
Water Rights: The Hidden Asset the Market Still Values at Zero
Water rights are the AI power trade's inevitable second derivative - and the market hasn't recognized it

What if I told you about an asset class that has compounded at roughly 11% annualized for thirty-five years, is inflation-protected, faces accelerating demand against diminishing supply, cannot be replicated by AI or any other technology, and is used by every American every single day?
No, it’s not Bitcoin. It’s Water - specifically, senior water rights in the western United States.
Water rights sit on company balance sheets at historical cost - often pennies on the dollar of fair market value. The public market hasn’t fully recognized this gap.
It’s reaching its breaking point.

Supply is drying up: The Colorado River simply doesn’t have enough water. April–July 2026 inflow to Lake Powell is forecast at 13% of normal - the lowest on record - driven by climate change and overuse. Lake Mead and Lake Powell sit at 30% and 23% of capacity. Arizona has already lost 18% of its allocation to mandatory cuts. The century-old framework allocating the river’s water to seven western states expires in October 2026 with no successor agreement, which would trigger federal intervention and forced cuts.
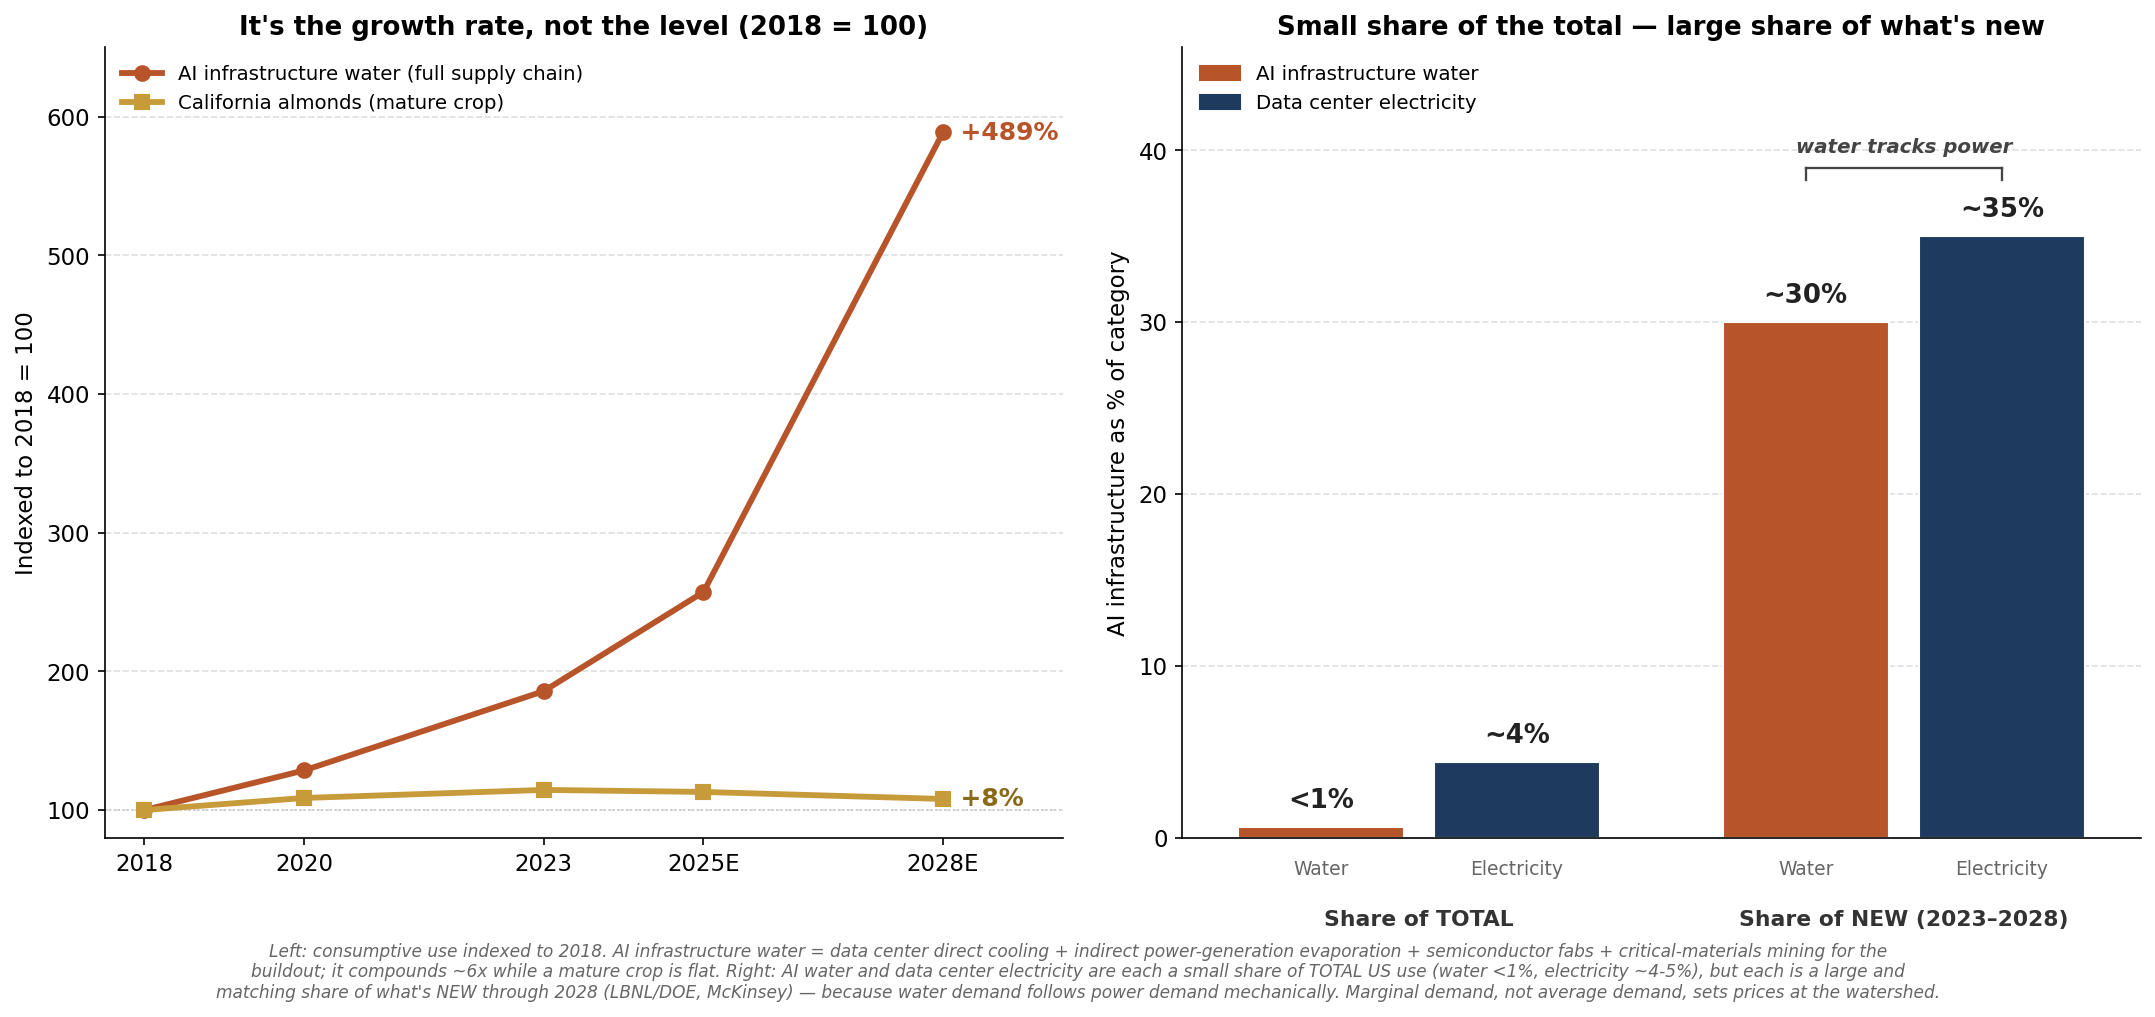
Incremental demand is accelerating: The trillion-dollar hyperscale data center buildout is doing to water what it already did to power over the last two years. Data center water demand is on track to triple from ~310 billion gallons today to nearly 1 trillion by 2028. Incremental water demand is an inevitable second derivative of power demand.
This is the setup for a multi-year repricing of water as an investable asset.
Why water is different from other commodities
Water rights are not water. They’re a permanent legal entitlement - a piece of property as real as a mineral right or a parcel of land, and tradeable in regulated state-level markets. In the western U.S., rights are ranked strictly by seniority: when water gets scarce, the oldest rights get their full allocation before any newer right gets a drop. Junior rights get cut to zero while senior rights keep flowing.
This creates four structural properties that distinguish water rights from any other commodity exposure:
1. Geographic non-fungibility. A CBT unit in northern Colorado cannot substitute for a Verde River right in central Arizona. There is no global market, no exchange-traded contract, no marginal producer in Saudi Arabia. Water doesn’t move between river systems, so each one sets its own price.
2. Negative-elasticity supply. There’s less water every year, but legal allocations haven’t been adjusted to match. Unlike oil, where high prices bring new supply, you can’t drill a new river.
3. Asymmetric monetization. Water rights can be sold outright, leased annually, dedicated to municipalities for tap fees, or used to support entitled land. The optionality is real and not captured in most accounting models.
4. Opaque transactional markets. Trades are governed by local conservancy districts, water courts, and state engineers. There is no Bloomberg ticker. Prices are recorded by district, often quarterly, often after a lag. This opacity is exactly why public-market equity values can stay disconnected from underlying water values for years.
The cleanest visible benchmark is the Colorado-Big Thompson Project unit market, run by Northern Water in Colorado. CBT units have traded actively for sixty years. The price record is the clearest demonstration of what water rights actually do.

From $1,500/unit in 1990 to $57,500 today, with an intermediate peak of $67,000 in 2023, with the bulk of the move concentrated in two episodes: the 1999–2000 Y2K front-range scare (when prices ran from $3,600 to $15,000 in two years) and the 2018–2023 megadrought repricing ($28,600 to $67,000). The 2024–2025 pullback to $57,500 reflects Northern Water’s deliberate dampening of the market through trading rule changes and the simple fact that nearly 90% of inventory is now held by municipalities and will never come back to the market.
Put the CBT compounding next to a broad equity benchmark and the asset class stops looking esoteric. CBT units have returned roughly 11.0% CAGR over thirty-five years on price alone - slightly ahead of the S&P 500’s ~10.6% total return CAGR over the same period, and well above the index’s 8.5% price-only CAGR.
The path is the story: CBT was flat-to-down from 2000 to 2012 while the S&P recovered from the dot-com bust, then ran four times faster than the index from 2012 to 2023. Water rights do not reprice continuously. They reprice in episodes, triggered by salient supply events, and the new floor never returns to the old ceiling. The 2026 Colorado River cycle has the ingredients of a third such episode.

The Colorado River, 2026
Two facts dominate everything else about the Colorado River system right now.
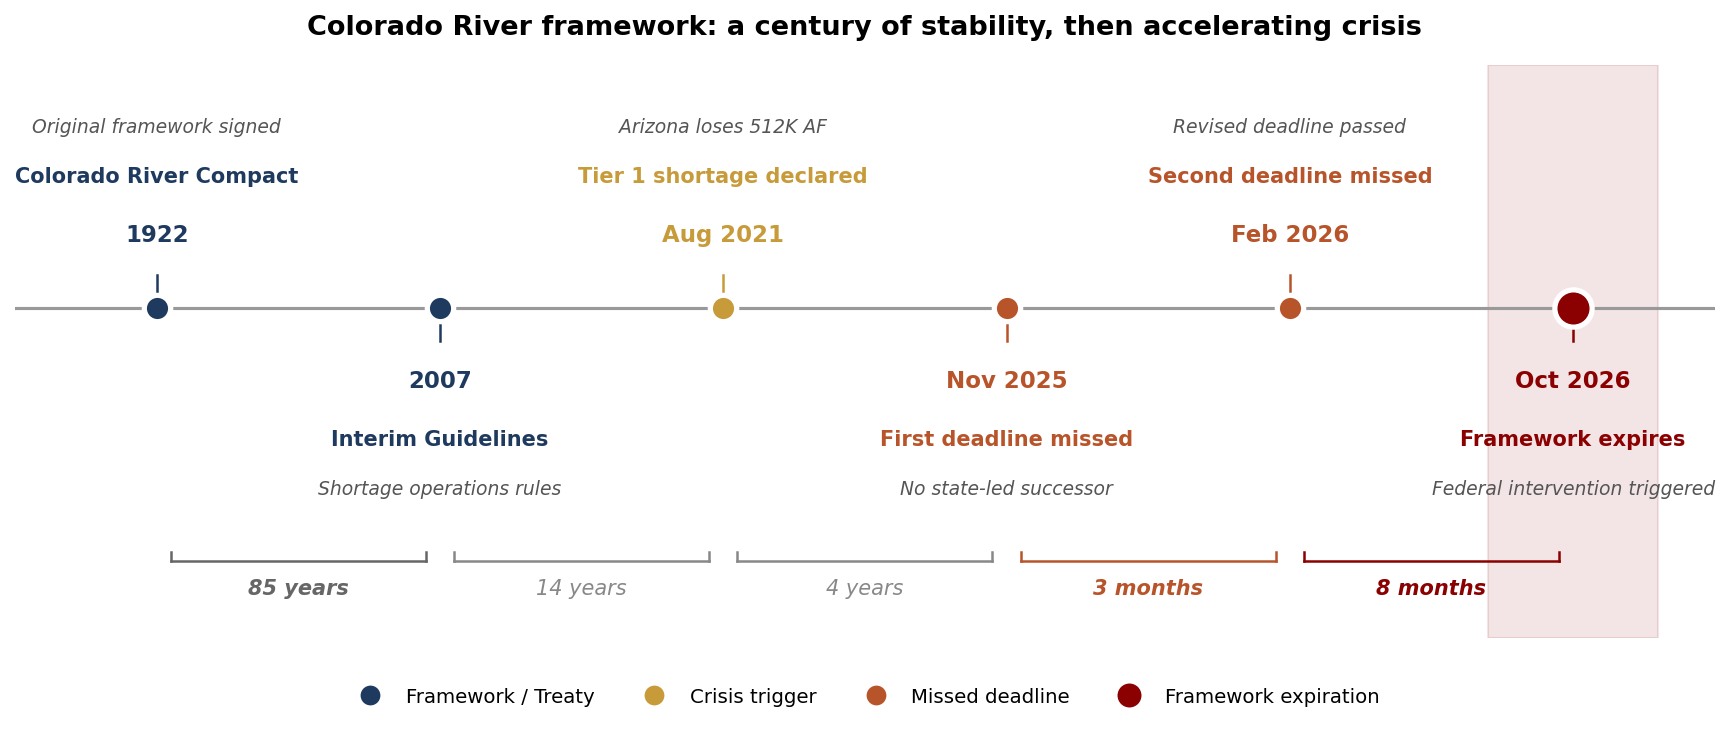
First, the 2007 Interim Guidelines and the 2019 Drought Contingency Plans expire at the end of 2026, and there is no consensus agreement to replace them. The Bureau of Reclamation set a deadline of November 11, 2025 for a preliminary seven-state framework. That deadline was missed. A revised deadline of February 14, 2026 was missed as well. Without an agreement, the federal government is statutorily empowered to impose its own framework - an outcome both basins prefer to avoid but which becomes more likely with each missed milestone. The Upper Basin (Colorado, Utah, Wyoming, New Mexico) wants shortages defined and shared based on actual hydrology. The Lower Basin (California, Arizona, Nevada) wants storage at Lake Mead used as the trigger. The two camps are not yet bridgeable.
Second, the underlying hydrology continues to deteriorate. As of May 2026:
Lake Mead: 30% full. Tier 1 Shortage in effect for 2026 - Arizona forfeits 512,000 AF (18% of allocation), Nevada gives up 21,000 AF, Mexico cuts 80,000 AF.
April-July 2026 Inflow to Lake Powell: 13% of average and the lowest on record.
Upper Basin snowpack: 23% of normal.

The dashed lines are the operational triggers. Mead at 1,025 ft triggers Tier 2/3 shortages with deeper cuts. Powell below 3,490 ft loses the ability to generate hydropower at Glen Canyon Dam - the “dead pool for power” scenario.
The Lower Basin states have already offered to conserve 1.5 million AF in any post-2026 framework. That offer should be understood not as a generosity but as a floor: 1.5 MAF is roughly what aridification - the long-term, permanent drying of the West - is taking out of the system anyway. Real reductions will be larger, and the question is which water users are first in line to give up their allocations.
The answer, by simple economics, is agriculture. Roughly 70-80% of all Colorado River water goes to agriculture, with alfalfa and cotton alone accounting for over 40% of basin use. A municipality cannot stop delivering water to homes; a farmer can fallow a field. When permanent reductions get distributed, they will be distributed disproportionately to ag users - either through mandatory cuts or through voluntary buyout programs where municipalities and industrial users pay farmers to retire their rights.
That transfer is the mechanism by which water rights reprice.
The repricing cascade
Most analysts stop at the first-order question - how much will basin allocations be cut. The investable thesis lives in the second- and third-order effects.

The cascade has several distinct beneficiaries:
Senior water right holders in growing watersheds. When a 200-acre alfalfa farm in Imperial County retires its right to free up water for San Diego, the transaction sets a new market clearing price. Every other senior right holder in the basin now has a comparable. This is the same dynamic that drove CBT unit prices from $8,000 to $60,000 between 2012 and 2020 - not new buyers, but new comparable transactions that revalued the existing stock.
Owners of entitled land near growth corridors. In Colorado, Nevada, Arizona, and parts of California, developers cannot get building permits without demonstrating a permanent water supply - typically 100 to 300 years depending on jurisdiction. As watershed supply tightens, the marginal cost of “water-attached” land rises faster than the cost of dry land. The same dynamic creates pricing power for any landowner who has already secured water rights for future development.
Holders of stranded ag water that can be re-purposed. Not all water rights are equal. Rights tied to agricultural use may have restrictions on transfer to municipal or industrial use; “change of use” proceedings can take years and require yield reductions. But where the work has been done (or can be done), the same acre-foot of water sells for 3-10x more to a city than to a farmer. This is the highest-IRR transaction in the system.
Power markets. Hydropower at Glen Canyon and Hoover generates roughly 10 TWh annually combined. As lake elevations decline, hydropower output drops, and the marginal generation that replaces it is natural gas. Power costs rise in the Lower Basin, which feeds into industrial siting decisions and ultimately into electricity prices for the entire WECC.
The third-order effects are subtle but important. Growth caps in Phoenix, Las Vegas, and parts of southern California are no longer hypothetical - they are operational. Buckeye and Queen Creek, Arizona have already issued moratoria on new development in areas without groundwater certification. This concentrates value into the limited subset of already-entitled, already-watered parcels.
For investors, the punchline is that water repricing happens not just through the rights themselves but through every asset that requires water as an input: residential lots, industrial facilities, agriculture, and increasingly, data centers.
The data center question
The most common pushback to the data center water thesis is that data centers don’t actually use that much water. The pushback has a real basis but is incomplete in two ways that matter for the investment case.
The honest version of the bear argument runs as follows. U.S. total water consumption is approximately 322 billion gallons per day (1,218 billion liters). U.S. data centers consumed about 17 billion gallons in 2023 for direct on-site cooling - roughly 0.014% of national daily use on an annualized basis. Microsoft has announced closed-loop, zero-evaporation cooling for new builds that eliminates evaporative water usage entirely. Apple, AWS, and Meta have similar trajectories. The hyperscalers, the argument goes, are solving the problem with engineering before it becomes one.
This is mostly true and misses the point.
There are three problems with the “data centers don’t use much water” framing:
One: indirect water consumption dwarfs direct. The 17 billion gallons of direct cooling ignores the water consumed at the power plants supplying data centers. The critical distinction is between withdrawal and consumption. At a natural gas combined-cycle consumption factor of roughly 0.20 gallons per kWh (the marginal generation serving new AI load) applied to 176 TWh of 2023 data center electricity demand, indirect consumption was approximately 35 billion gallons - roughly 2x the direct figure, and permanent consumption of water. The LBNL 2024 study projects data center electricity use could double or quadruple by 2028, and because new gas and data-center capacity overwhelmingly uses recirculating cooling towers (high consumption, low withdrawal), the consumptive share of the footprint grows with the build-out.
Two: water is a watershed problem, not a national problem. Aggregating data center water use as a percentage of national consumption is the wrong frame. Google’s facility in The Dalles, Oregon consumes 29% of that city’s total water. A single hyperscale campus in Phoenix or Mesa can draw more water than a town of 50,000 people. The CHIPS Act semiconductor buildout amplifies this concentration further - TSMC’s Arizona fabs alone are tracking toward billions of gallons annually in Phoenix, the same metro already absorbing Colorado River Tier 1 cuts. The relevant question is not whether data centers consume meaningful water at a national scale (they don’t) but whether they consume meaningful water in the specific river systems or watersheds where they’re being built (they do).
Three: zero-water cooling has a tradeoff. Microsoft’s closed-loop design eliminates evaporative water use but requires more electricity to run the chillers - roughly 15-30% more energy in hot climates. More electricity means more indirect water consumption upstream, unless the marginal generation is wind, solar, or nuclear without water-cooled condensers. The accounting moves the water consumption around; it does not eliminate it from the watershed-level analysis.
The investable conclusion is that data centers are a marginal demand source for water, not the dominant one - but marginal demand is what sets prices. Data center electricity demand is growing at an accelerating rate: a ~7% CAGR from 2014–2018, rising to 18% from 2018–2023, and a projected 13–27% through 2028, on track to account for 30–40% of all net-new U.S. electricity demand. Water demand follows mechanically. That demand is small against national totals but decisive at the margin.
The water rights thesis doesn’t depend on data centers, but they act as a multiplier - accelerating both the timeline and magnitude of the eventual repricing.
Water and the power bottleneck
The data center buildout has created two parallel scarcity trades: power and water. The power trade is loud and crowded. The water trade is quiet and largely untouched. The contrast is instructive.
Both share the structural features that make a resource investable. Both have inelastic supply on relevant timeframes: a new combined-cycle gas turbine takes 3 to 5 years from order to commissioning, a nuclear restart takes 2 to 4, and the major OEM order books are already booked through 2030. Water infrastructure is worse - a new transbasin aqueduct or major reservoir takes 15 to 30 years and a near-impossible permitting fight. Both have shrinking or stagnant supply curves over the past decade: U.S. coal retirements have removed roughly 100 GW of nameplate generation since 2015, while Colorado River aridification has subtracted roughly 1.5 MAF from the system’s reliable yield. Both have the same marginal demand shock - the same hyperscalers competing for the same megawatts and gallons in the same handful of locations.
Three differences matter for the relative trade.
Power can be added. Water cannot. Gas turbines, nuclear restarts, behind-the-meter generation - power supply expansion is slow but mechanically possible, and capital is flowing. Water cannot be created at any meaningful scale; desalination is bound to coastal applications at multiples of senior-rights pricing, and recycled water only stretches existing supply. Senior rights to existing watersheds are a permanent scarcity in a way that megawatts simply are not.
Power has a regional market. Water does not. Interconnects and PPAs let electrons move across thousands of miles with predictable transmission losses. A surplus in West Texas can serve a load in Dallas. Water has no equivalent. A surplus in the Great Lakes cannot reach Maricopa County - pipelines don’t exist at scale, energy economics prohibit them, and political economy prohibits the rest. Water markets clear watershed by watershed.
The power trade is priced in. The water trade is not. Equities tied to the data center power narrative have run 5–10x in 18 months - gas turbine OEMs, nuclear operators, transmission utilities, and uranium plays have all been re-rated. The water-rights complex hasn’t moved. Public water-rights vehicles trade at the same NAV discounts they did five years ago, and SGMA milestones in California have come and gone without market response. Whatever the merits of the power trade, the asymmetry has compressed as the market has recognized it. The water trade is where the same logic - with worse supply elasticity -still hasn’t been priced.
The lag in market recognition
A natural follow-up question: if power and water are both data-center scarcity stories, why did the power narrative go mainstream in 2024-2025 while the water narrative is only entering institutional consciousness now? The answer is that the lag is in market recognition, not in physical demand.
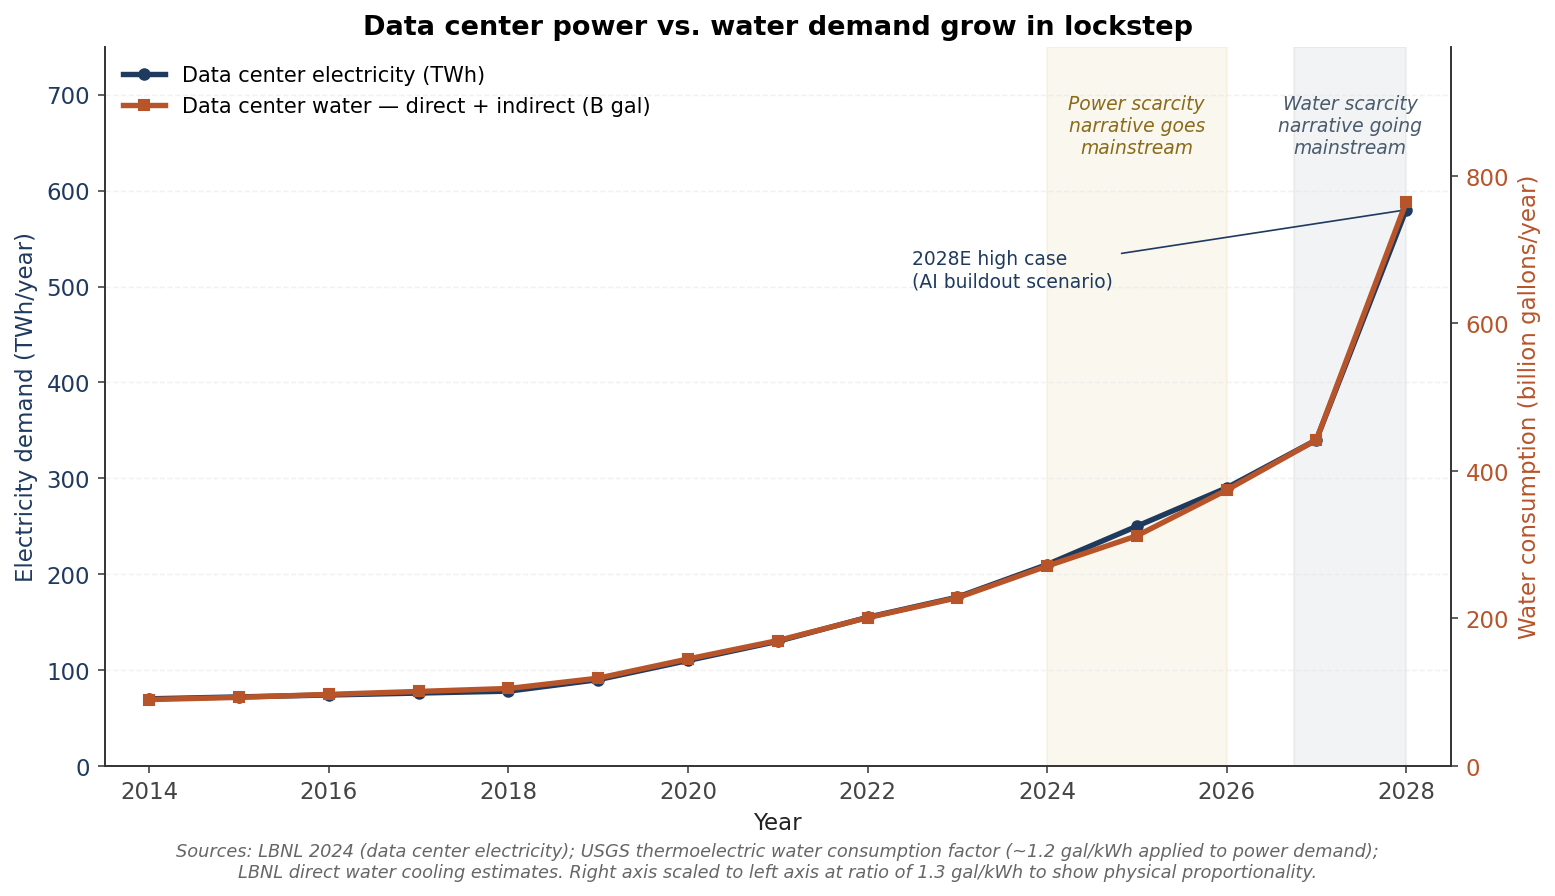
Power and water demand from data centers grow in physical lockstep. Roughly 60% of U.S. electricity still comes from thermoelectric generation (gas, coal, nuclear), and every kWh of that generation consumes ~1.2 gallons of water at the cooling tower. Add the ~0.1 gallon per kWh of direct on-site cooling and the relationship is about 1.3 gallons of water per kWh of data center electricity demand. There is no meaningful timing gap between when a new data center starts pulling power and when the system starts consuming additional water. The demand curves are not just correlated - they are the same curve, expressed in different units.
Why, then, did the public conversation lag by 18-24 months? Three reasons.
Power constraints are visible at the interconnect queue. Water constraints are invisible until they bind. You can read public PJM and ERCOT interconnect queues to see the GW of stranded data center load. There is no equivalent public registry of pending water-rights disputes or watershed-level constraint risk. The constraint exists but takes longer to surface.
Power markets price at minute frequency. Water markets price at quarter frequency or are completely opaque. When PJM capacity prices ran from $29/MW-day to $269/MW-day in the 2024 auction, the price spike was on a Bloomberg terminal the same week. CBT water unit transactions are settled quarterly through a conservancy district board, and many other water markets don’t have readily available data. The price signal that drives institutional attention is simply louder and faster for power.
Power has named public vehicles. Water mostly does not. When the power scarcity narrative emerged, there were obvious tickers to buy: Constellation (CEG), Vistra (VST), GE Vernova (GEV), Cameco (CCJ), Talen (TLN), Oklo (OKLO). When the water scarcity narrative emerges, the relevant tickers are PCYO, BWEL, LMNR, and IPI - a $250M utility, an OTC pink-sheet farmer, a 132-year-old California citrus grower, and a fertilizer company most investors have never heard of. The vehicles exist, but they have to be sought out.
Does the power bottleneck necessitate a water bottleneck?
Mechanically, yes. As long as the marginal kWh of data center power comes from thermoelectric generation, it draws water - and a portion is permanently consumed through evaporation. The U.S. grid will not decarbonize fast enough to break the linkage on the timeframe relevant to this thesis: even in aggressive scenarios, thermoelectric generation supplies a majority of incremental demand through 2030+. The 580 TWh high case for 2028 data center demand implies roughly 700+ billion gallons of water withdrawal per year - of which the permanent consumptive loss is on the order of 115-150 billion gallons, up from roughly 35 billion in 2023.
Two wrinkles matter, both reinforcing the watershed framing developed earlier.
First, the water consumption happens at the power plant, not at the data center. A data center in Northern Virginia drawing power from a Pennsylvania gas plant consumes Susquehanna water, not Potomac water. As hyperscalers move toward co-located generation (behind-the-meter gas turbines, dedicated PPAs with new build power) the water consumption increasingly co-locates with the data center load. This concentrates the watershed impact where the loads are concentrated - Maricopa County, Northern Virginia, central Texas, the Columbia Basin.
Second, the “solutions” to the power bottleneck mostly do not solve the water bottleneck. Switching from coal to combined-cycle gas reduces water use per kWh by roughly 40%, but the absolute demand is growing 4-8x. Nuclear restarts consume more water per kWh than gas. Wind and PV solar do not consume water in operation, but the marginal new generation through 2030 is dominantly gas and nuclear, not wind and solar. Hyperscalers have announced ambitious behind-the-meter solar and storage projects; in practice, the bulk of new data center power on the next-five-year horizon is thermal.
Put it simply: the power bottleneck is the leading indicator. The water bottleneck is the second-derivative consequence, lagging by 12-24 months in market recognition but already locked in physically. By the time the water-rights complex gets priced like the power complex did in 2024-2025, the move is done. The setup window is the gap between recognition events.
SGMA: California’s slow-motion version
The Sustainable Groundwater Management Act of 2014 requires California groundwater basins designated as critically overdrafted to reach sustainable yield by 2040, with interim milestones every five years. The Public Policy Institute of California estimates 500,000 to 900,000 acres of San Joaquin Valley farmland will need to be permanently fallowed to comply.
That fallowing process is already underway. Groundwater Sustainability Agencies are setting pumping caps. Trading platforms for groundwater extraction credits have launched in several basins. The water that gets freed up has three potential uses: it can be left in the ground (no buyer), sold to higher-value crops (limited buyer), or sold to municipalities and industry (highest-value buyer, requires institutional infrastructure to transact).
The slope of this is gradual - 2040 is fifteen years out - but the present-value implications are visible now. Owners of senior surface water rights in California (rights that predate SGMA’s groundwater regime entirely) become disproportionately valuable as groundwater becomes scarcer. This is the J.G. Boswell setup, discussed below.
Michael Burry’s variant
One of Michael Burry’s most-discussed post-Big-Short investments is water - but he explicitly rejected buying water rights. In a 2010 interview with New York magazine, he said: “Transporting water is impractical for both political and physical reasons, so buying up water rights did not make a lot of sense to me. What became clear to me is that food is the way to invest in water. That is, grow food in water-rich areas and transport it for sale in water-poor areas. This is the method for redistributing water that is least contentious, and ultimately it can be profitable.”
The reasoning is sound and worth taking seriously. Direct water rights are politically sticky - transferring agricultural water to municipal use takes years of “change of use” proceedings and often comes with yield haircuts. Direct water rights are also physically constrained - you can’t pipe Colorado water to Iowa. Food, by contrast, is fungible. An almond grown in California arrives in New York at retail, and the ~1 gallon of embedded water per almond moves with it.
Burry’s chosen vehicle is water-rich farmland growing water-intensive crops - primarily almonds. Two implications for the thesis here.
First, Burry’s strategy is the J.G. Boswell business model in private form. Boswell is what happens when Burry’s approach scales to 150,000 acres, a century of accumulated senior rights, and a public ticker. The lesson is not that Burry is wrong to favor farmland over rights - he’s correct that for an individual investor with limited capital and no political access, owning land is easier than owning water. But for an investor who can buy a public ticker, the asymmetric play is BWEL, where you get Burry’s strategy plus a 70-90% discount to underlying water value because the market doesn’t value it.
Second, Burry’s retreat from public markets is itself a signal. The most cited macro contrarian of the past generation has concluded that the most interesting trades are in resources that don’t fit on a Bloomberg screen. The trade you can’t easily index, easily ETF, or easily trade is the trade that hasn’t been crowded into. That is a substantial part of why the public-market water-rights complex still trades at the discounts it does.
How to play the thesis
Three categories of exposure are worth considering: direct ownership of water rights through private vehicles, public proxies where water rights dominate enterprise value, and indirect plays on water-dependent asset categories (entitled land, ag-to-muni transfer platforms, power generation infrastructure, and critical-minerals mining).
Direct ownership is the highest-fidelity exposure but requires intermediary access. For most public-market investors, the second category is where the asymmetric setups live.
Three names where the water rights alone are worth more than the entire company:
Pure Cycle Corporation (PCYO)
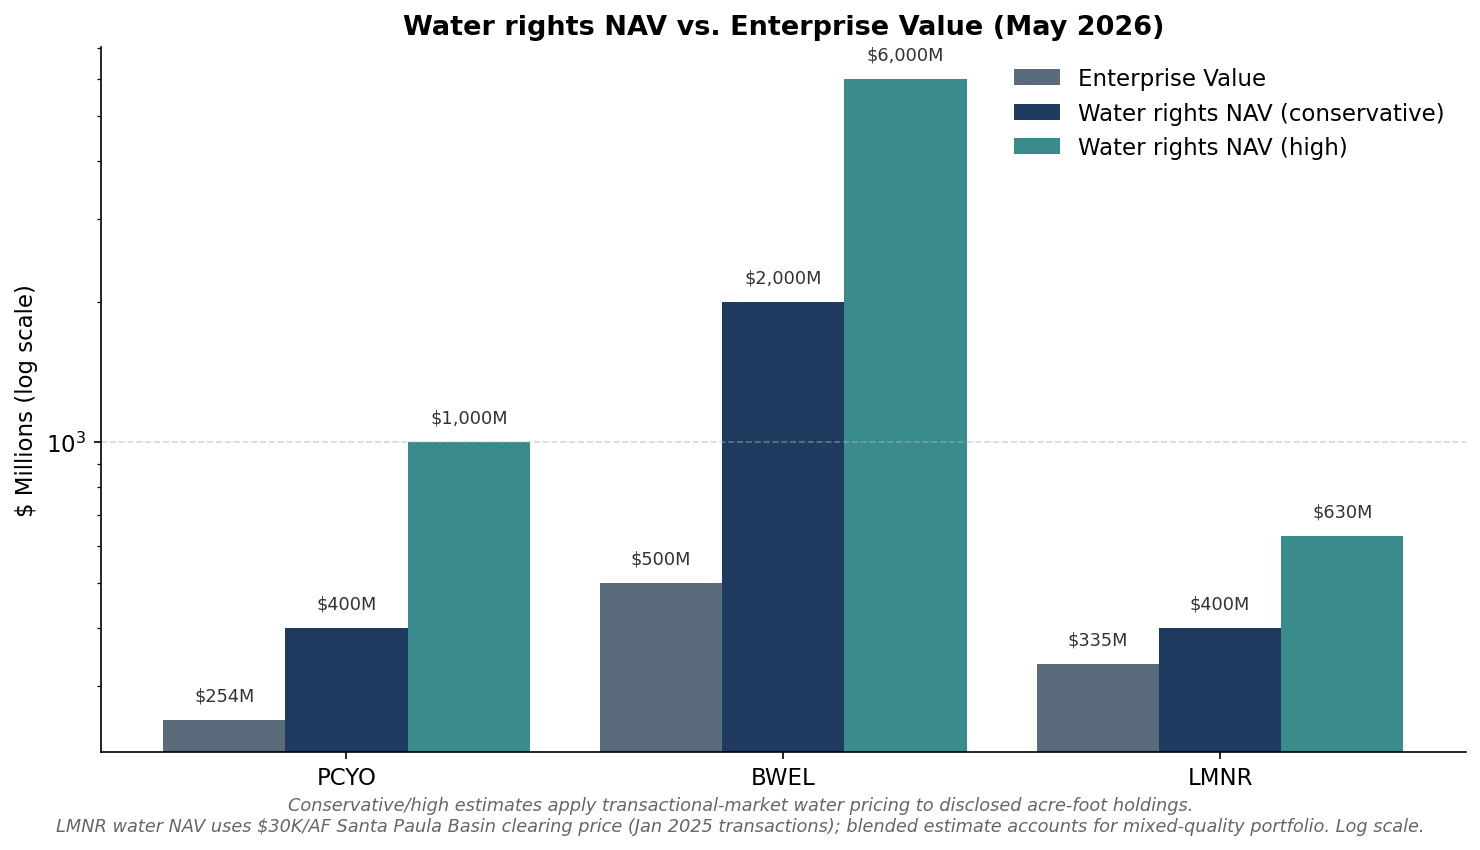
Market cap ~$265M | EV ~$254M | Water rights NAV: $400M-$1B (conservative-high)
Our PCYO thesis: Latest Update (May 2026), Part 1 (Overview), Part 2 (Deep Dive)
Pure Cycle owns a portfolio of Colorado water rights including approximately 29,500 acre-feet of groundwater and surface water in the Denver metro area, 26,000 acre-feet of adjudicated reservoir storage rights, the right to develop an additional 14,000 acre-feet off the Lowry Range, and a separate ~70,000 acre-feet position on Colorado’s western slope. Recent additions include 800 AF of Lost Creek water, 1,635 AF from a December 2025 Box Elder Creek settlement, and 75 AF of deep groundwater. The Denver-region portion alone, valued at current CBT-equivalent prices of roughly $57,000 per AF, is worth approximately $1.7 billion. Even haircut to $13,000 per AF (the trough of the past decade) to reflect that not all rights are CBT-equivalent, the Denver portion is worth $385M - already above the entire enterprise value.
The market currently values PCYO based on its master-planned community at Sky Ranch and its operating water/wastewater utility business - both real but small. The water rights are essentially free optionality. The catalyst is continued development at Sky Ranch (which monetizes water via tap fees), and longer-term, the inevitability that Denver-area municipalities will need to buy additional supply. PCYO is the lowest-controversy way to own pure Colorado water rights exposure in a public structure.
J.G. Boswell Company (BWEL)
Market cap ~$516M | EV ~$500M | Water rights NAV: $2B-$6B
Our BWEL thesis: Latest Update (May 2026), Part 1 (Overview), Part 2 (Deep Dive)
J.G. Boswell is the largest private farm in the United States: roughly 150,000 acres of California farmland sitting on the dry bed of the former Tulare Lake in Kings and Kern Counties, plus 30,000+ acres in Australia. The agricultural business - pima cotton, processing tomatoes, alfalfa - generates real cash flow and pays a dividend of roughly 3.8%. But the actual asset is the company’s water position: an estimated 400,000 acre-feet of senior surface water rights from sixteen rivers feeding into the Tulare basin, plus groundwater rights that pre-date SGMA’s regulatory regime.
Even at conservative California water values of $5,000 per AF - well below what San Joaquin Valley municipalities have paid in distressed transactions - the surface water rights alone are worth $2 billion. At premium “muni-grade” values of $15,000 per AF, the figure is $6 billion. The company trades at a $516 million market cap.
The catalyst question for BWEL is harder than for PCYO. The Boswell family has shown no interest in monetizing the water rights for forty years. The stock trades by appointment on the pink sheets - under 300 daily volume - and is non-reporting. The thesis is essentially that SGMA forces fallowing of less-senior water positions around Boswell’s land, raising the implied value of Boswell’s own rights without any management action required. It is a generational holding, not a six-month trade. But the asymmetry - paying $0.20 on the dollar (conservative) or $0.08 on the dollar (high) for water rights inside an operating business - is rare in any asset class.
Limoneira Company (LMNR)
Market cap ~$235M | EV ~$335M | Water rights NAV: $400M–$630M
Our LMNR Thesis: Latest Update (May 2026)
Limoneira is a 132-year-old California agribusiness with approximately 7,000 acres of citrus operations across Ventura, Tulare, and San Luis Obispo Counties. The agricultural business - lemons, oranges, avocados, wine grapes - generates operating revenue, and a real estate development pipeline (Harvest at Limoneira) provides incremental land monetization. But like Boswell, the operating business is the cover story. The actual asset is the company’s water position: approximately 21,000 acre-feet of senior groundwater and surface water rights accumulated through more than a century of efficient water application and strategic land acquisition. The portfolio spans the Santa Paula and Fillmore Basins in Ventura County, the Paso Robles Basin in San Luis Obispo County, and Class 3 Colorado River water rights.
In January 2025, Limoneira completed three separate water pumping rights transactions in the Santa Paula Basin at $30,000 per AF - establishing a clean market clearing price for the highest-quality rights in the portfolio. Applied to the full retained position, the implied water rights NAV ranges from ~$400M (blended estimate reflecting lower pricing for Paso Robles and Class 3 Colorado River rights) to ~$630M (Santa Paula pricing applied across the entire portfolio). Against an enterprise value of ~$335M, the water rights alone are worth 1.2x to 1.9x the entire company.
What separates LMNR from PCYO and BWEL is that the monetization is already underway on a published schedule. In November 2025, management announced an explicit value creation strategy identifying $50–70M of additional near-term water rights monetization, alongside $355–405M of identified real estate monetization. The water rights aren’t a passive asset waiting to be discovered. They’re being actively sold to local buyers at established prices, with management explicitly framing the monetization as a principal source of forward shareholder value.
Other names worth investigating
A handful of additional names sit on the spectrum from “obvious water play” to “water as one of several hidden assets”:
Intrepid Potash (IPI): In April 2026, Intrepid sold the Intrepid South Ranch (21,793 acres + 27,858 acres of federal grazing leases + associated water rights) to HydroSource Logistics for $70M, against ~$19M book value - a 3.7x premium with the differential almost entirely attributable to water rights. This is the cleanest transaction comparable for the thesis: water rights inside an operating company, carried at near-zero by the market, monetized at 3-4x book value. Post-sale IPI is a more potash-focused business with residual rights and a produced water royalty stream - less compelling as a forward setup than it was a year ago.
LandBridge (LB): Permian Basin landholder (~270,000 acres) with significant surface and groundwater rights. Sells fresh water to oilfield operators and earns royalty income from surface and produced-water disposal use. The Permian expression of monetized water rights - in the same vein as the institutional reset that already played out at Texas Pacific Land Corp, but earlier in its discovery cycle.
Farmland Partners (FPI) and Gladstone Land (LAND): The two US public farmland REITs. FPI is larger (~150,000 acres, mixed permanent and row crops); LAND is smaller and more concentrated (~115 farms in California and the Pacific Northwest, focused on permanent crops with senior water rights or reliable groundwater). Together they’re the cleanest public-market expression of Burry’s “buy the food, not the rights” approach - though the REIT structure adds G&A drag and a management layer that direct private ownership (Burry’s chosen vehicle) avoids.
PICO Holdings / Vidler Water: previously the canonical public water play; the Vidler buyout (acquired by D.R. Horton in 2022) was the comparable that proved the institutional bid for water-rights vehicles. D.R. Horton paid roughly $20,000/AF for the 12,628 AF of “ready to use” rights - in line with Vidler’s prior retail transaction prices of $20,000-$35,000/AF.
Risks and how to think about them
Time horizon. The thesis has been right for thirty years and still hasn’t been fully priced by the market. That tells you something both encouraging (the mispricing is durable) and uncomfortable (the catalyst calendar is glacial). But what hasn’t existed before is the current setup: accelerating demand from the data center buildout colliding with structurally shrinking supply from a drier climate and the Colorado River’s expiring framework. For three decades the thesis ran on one engine - slow agricultural demand grinding against a fixed supply (which led to an 11% CAGR). Now both sides of the equation are moving at once - accelerating demand with shrinking supply. That doesn’t compress the catalyst calendar to quarters, but it does mean the next repricing cycle has reflexivity the prior thirty years never had.
Political and expropriation risk. Water rights are property rights, but they exist within a political regime. The Public Trust Doctrine in California, environmental flow requirements, and tribal water settlements all create ways in which private water rights can be effectively reduced without compensation. The Navajo Nation’s pending water rights settlement and other tribal claims represent a real political claim on a portion of Colorado River allocations. This is unlikely to manifest as outright takings but does cap the upside.
Technology displacement. Desalination is the always-cited risk. The cost curve has come down - modern reverse osmosis runs roughly $2,000-$3,000 per AF in coastal applications, well below the $30,000+ that interior municipalities pay for senior rights. But desal only solves the problem for coastal cities (Los Angeles, San Diego, Tijuana) and requires energy intensity that makes it uneconomic in interior markets. Recycled water is more material; Las Vegas now recycles roughly 99% of indoor wastewater. The marginal supply tools matter, but they don’t reach the senior-rights markets in agricultural valleys.
Aridification accelerates beyond pricing. Counterintuitively, the worst outcome for water-rights values is one where aridification gets so severe that the political response is rationing rather than market clearing. Mandatory cuts to senior rights, while legally difficult, become more plausible at very low reservoir elevations. This is a tail risk that grows with each year of below-average precipitation.
Conclusion
The bull case here is simple but worth stating cleanly. The United States is in the early innings of a structural repricing of water as an asset class, driven by aridification (long-duration supply contraction), municipal and industrial growth in arid regions (intermediate-duration demand), and data center buildout (acute marginal demand in specific watersheds). The forcing function for the next price discovery cycle is the post-2026 Colorado River framework, which will be set within the next 12 months under conditions of acute supply stress.
This is not a crowded trade. The relevant public universe is small and the catalysts are years out rather than weeks. That is precisely what makes the setup interesting.
The risk-reward is asymmetric in the way these setups always are when an asset class is structurally mispriced. The upside could mirror the 5–10x re-rating that played out in the data center power complex over the last 24 months - driven by the same demand vector, with a tighter supply side. The downside is bounded by the fact that the market currently values the water inside these companies at zero. There isn’t much further down for an asset that’s already priced at nothing.
The market will eventually price these assets correctly. The investor’s edge is patience and the willingness to hold an asset whose value is not visible on a Bloomberg screen. So water you waiting for?
Simply an outstanding piece of writing. Why has no one commented? I must plow through the post a few more times, as there is much to consider here. Well done.
The US model of privatised water rights does not travel well in Asia. Singapore treats water as national security, not a tradable asset. Instead of relying on markets, it secures supply through NEWater, desalination, and strict pricing. For investors in Southeast Asia, the opportunity is not water rights. It is the infrastructure behind water resilience: membranes, recycling systems, and AI-driven distribution.