
U-Haul (UHAL) | Part 2: NAV Deep Dive
Evidence-Based Asset-by-Asset Breakdown

1. Property, Plant & Equipment: What U-Haul Actually Owns
The starting point for any asset-level valuation is understanding what the company physically owns. U-Haul’s 10-K and quarterly earnings supplements disclose PP&E at historical cost with remarkable granularity. Below is the complete PP&E schedule as of the three most recent reporting dates, sourced directly from the company’s SEC-filed earnings supplements.
1.1 PP&E at Gross Historical Cost (in thousands)
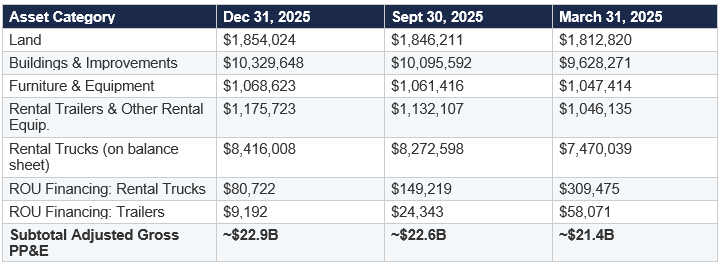
Source: SEC filings for fiscal quarters ending 12/31/2025, 9/30/2025, 6/30/2025, and 3/31/2025. PP&E adjusted tables include ROU-financing assets per company supplemental disclosure.
Several observations emerge from this schedule. First, the real estate base (land plus buildings) totals approximately $12.2 billion at gross historical cost as of December 2025, up from $9.9 billion just 21 months earlier at March 2024. This is one of the largest privately held real estate portfolios in North America, concentrated in self-storage facilities and U-Haul operating centers, and it is carried on the balance sheet at depreciated historical cost that is almost certainly far below market value.
Second, the rental truck fleet (including ROU financing leases) totals approximately $8.5 billion at gross cost. After accumulated depreciation, the net book value is substantially lower, and the gap between book value and fair market value of used trucks is a key variable in understanding the earnings headwind.
Third, the rate of real estate investment has been extraordinary. Buildings and improvements grew by approximately $2.1 billion ($10.33B less $8.24B) in just 21 months from March 2024 to December 2025. At an average development cost of roughly $100-130 per net rentable square foot (U-Haul’s internal development costs, well below the industry’s current $200-300/sqft replacement cost), this capital is creating assets at enormous embedded margins.
2. Self-Storage Portfolio: The Crown Jewel

2.1 Portfolio Scale & Growth Trajectory
As disclosed in the Q3 FY2026 earnings release (February 4, 2026), U-Haul now operates approximately 1,126,800 rentable storage units comprising roughly 98.0 million net rentable square feet. This makes it the third-largest self-storage operator in North America behind Public Storage (~200M sqft) and Extra Space Storage (~180M sqft including managed properties), but it is growing far faster than either incumbent.
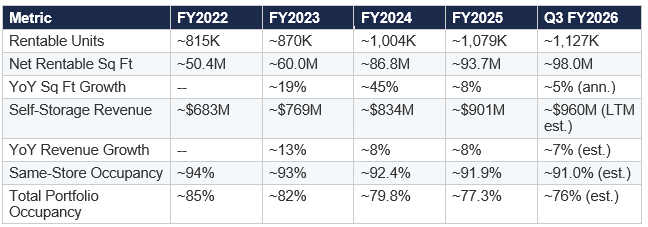
Source: U-Haul Holding Company quarterly press releases filed with the SEC (FY2022-FY2026); Zacks Small Cap Research annual review (June 2025); Q3 FY2026 press release (February 4, 2026). LTM estimates are author calculations based on disclosed quarterly run rates.
The gap between same-store occupancy (~91%) and total portfolio occupancy (~76%) is the single most important number in this analysis. It represents the lease-up runway. Roughly 22 percentage points of the portfolio are newly developed properties working toward stabilization. At 98 million square feet, each percentage point of occupancy represents approximately 980,000 square feet of additional occupied space.
2.2 NOI Construction from First Principles
U-Haul does not break out self-storage NOI as a discrete line item. We must build it from disclosed components.
Step 1: Revenue
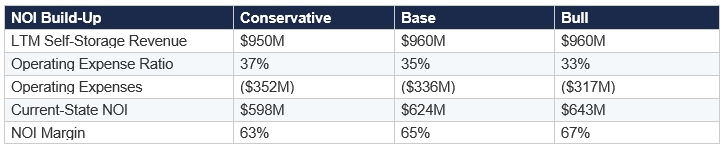
Self-storage revenue from company-owned locations for FY2025 was disclosed at approximately $901 million, up 8.0% ($66.8 million) from FY2024. In Q1 FY2026, self-storage revenue grew 8.6% year-over-year to approximately $234 million for the quarter. For the nine months ending December 2025, annualizing at the disclosed run rate, we estimate trailing twelve-month self-storage revenue of approximately $950-970 million.
Step 2: Operating Expenses
Self-storage is among the lowest operating-cost real estate asset classes. Public Storage reports same-store operating expense ratios of approximately 27-30% of revenue. Extra Space operates at roughly 32-35%. CubeSmart at 33-36%. U-Haul’s operating costs should be at or below industry averages because of shared overhead with the moving business, including shared labor, shared real estate (many storage locations are co-located with moving centers), and shared marketing (50% of storage customers come through moving transactions).
We conservatively estimate U-Haul’s self-storage operating expense ratio at 33-37% of revenue. The higher end accounts for the fact that newly opened facilities have higher expense ratios before achieving stabilized occupancy. As properties lease up, the expense ratio should compress toward 30%.
Step 3: Stabilization Adjustment
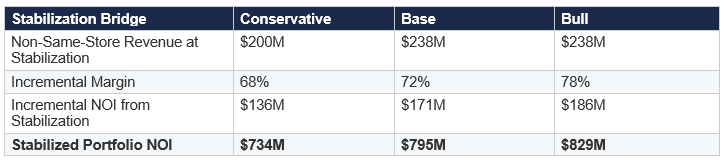
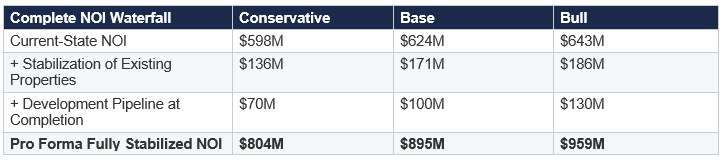
Management disclosed in the FY2025 earnings release that non-same-store locations are expected to generate an additional $238 million in annual revenue when stabilized to 90% occupancy. This is not a speculative number; it was provided by management in their investor presentation and represents the mechanical revenue impact of filling existing, physically completed storage units to a normalized occupancy level.
The incremental margin on storage revenue above break-even is extremely high, typically 70-80%, because the major costs (property taxes, insurance, management overhead) are largely fixed. We apply a 72% incremental margin to the $238 million revenue uplift.
Step 4: Development Pipeline
Beyond the existing portfolio, U-Haul disclosed (Zacks, FY2025 review) that approximately 7 million net rentable square feet are actively under development with another 8 million square feet in pending pipeline, for a total of ~15 million square feet. At stabilized revenue per occupied square foot of approximately $12.50-$13.00 (implied from ~$960M revenue / ~76M occupied sqft) and 90% occupancy, this pipeline could generate approximately:
15M sqft x 90% occupancy x $12.75 revenue/sqft = ~$172M in additional annual revenue. At a 70% NOI margin, this implies approximately $120 million in additional NOI from the pipeline. Management’s own disclosure projects $124M from projects in development and $129M from pending projects, totaling $253M in pipeline revenue, broadly consistent with our estimate.
2.3 Cap Rate Application & Comparable Evidence
The choice of capitalization rate is the most impactful single variable in the storage valuation. Industry data provides robust benchmarks:
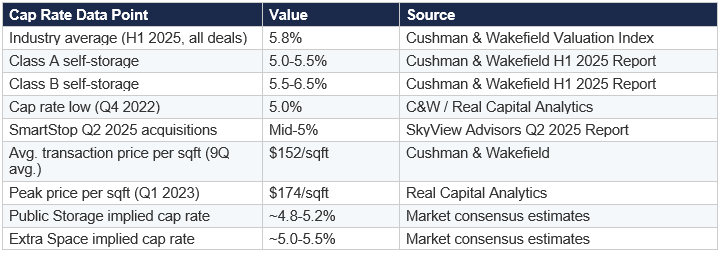
Source: Cushman & Wakefield U.S. Self Storage Market Outlook (September 2025); SkyView Advisors Q2, Q3, Q4 2025 Self-Storage Industry Reports; CRE Daily (September 2025); Argus Self Storage Advisors (October 2025). Cap rate data represents transactional evidence from marketed deals.
U-Haul’s portfolio is a mix of high-quality newer development (climate-controlled, well-located, built since 2020) and older, more basic facilities. A blended cap rate of 5.75-6.25% is appropriate for the existing portfolio, with a slightly lower rate applied to the stabilized pro forma NOI given the embedded mark-to-market on newer facilities built at below-replacement cost.
2.4 Self-Storage Valuation Matrix
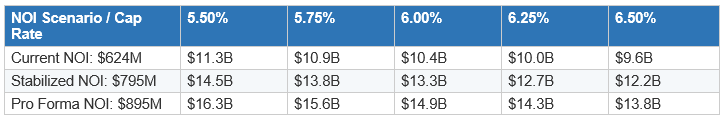
Selected valuation range: $12.5 billion to $16.3 billion. Midpoint of ~$14.0 billion at stabilized NOI and a 5.75% blended cap rate. For additional triangulation, applying the industry average transaction price of $152 per square foot to U-Haul’s 98 million square feet yields $14.9 billion, falling squarely within our range.
2.5 Cross-Check: Replacement Cost
Current replacement cost for self-storage has risen dramatically due to labor and material inflation. Industry sources cite new construction costs of $200-300 per net rentable square foot, depending on climate control and location. At 98 million square feet:
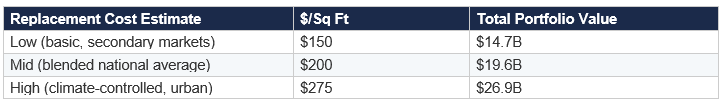
U-Haul developed much of its storage at $60-130 per square foot. The replacement cost analysis confirms that the portfolio was assembled at a fraction of what it would cost to build today, providing an additional margin of safety to the cap rate valuation.
3. Self-Moving Equipment: The Franchise Value
3.1 Revenue & Profitability Analysis
The self-moving business encompasses truck, trailer, and towing device rentals, plus ancillary product sales (moving supplies, trailer hitches, propane) and the U-Box portable storage program.
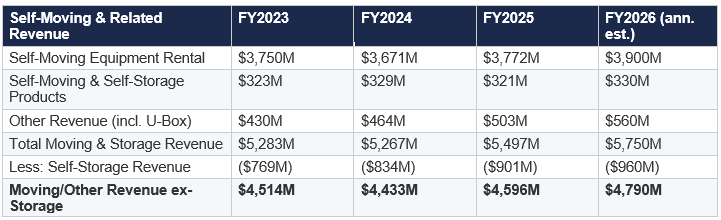
Source: U-Haul Holding Company annual and quarterly press releases; Zacks SCR FY2025 annual review. FY2026 estimates are author projections based on disclosed quarterly trends.
3.2 Normalized EBITDA for the Moving Business
The Moving and Storage segment reported EBITDA of $1,619.7 million for FY2025 (up $51.7M from FY2024). However, this includes the self-storage contribution. To isolate the moving business, we subtract estimated storage NOI and add back the temporary fleet headwinds:
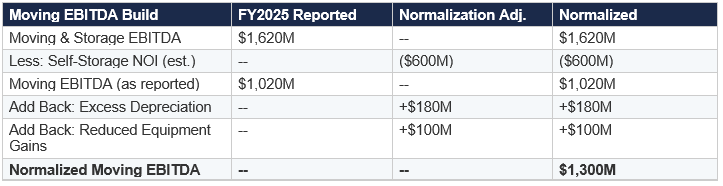
The $180 million excess depreciation add-back represents the differential between the elevated per-unit depreciation being charged on trucks acquired at inflated OEM prices (due to EV subsidy cross-subsidization, per management commentary) versus historical normalized rates. Management has stated fleet capex will be reduced by $500 million in FY2027, implying the normalization process is already underway.
The $100 million equipment gains add-back is conservative. In peak years (FY2022-FY2023), gains on sale of retired equipment exceeded $400 million annually. We do not assume a return to peak levels, but a normalization from the current depressed ~$50-60 million to a mid-cycle level of $150-200 million is reasonable, yielding a ~$100M add-back.
3.3 Franchise Valuation
What multiple should the self-moving business command? This business has several characteristics that argue for a premium multiple:
It is a near-monopoly. After Budget Truck exited nationwide one-way moving, U-Haul has no direct comparable competitor at scale for consumer one-way truck rental. Penske operates fewer than 2,700 locations versus U-Haul’s 25,000+. The network effects are structural and self-reinforcing.
It generates enormous, predictable cash flow. Even in cyclically weak years, moving revenue has never declined more than mid-single digits. People move for jobs, family, school, divorce, and dozens of other non-discretionary reasons.
It is the customer acquisition engine for the storage business. Nearly 50% of storage customers originate from a moving transaction, providing zero-cost customer acquisition for a business with 70%+ margins.
Comparable Multiples
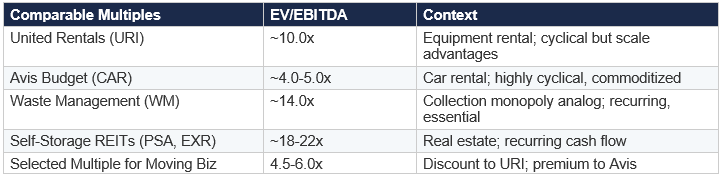
Moving Business Valuation

Selected range: $5.0 billion to $8.4 billion. Midpoint of approximately $6.5 billion. Note that the bear case alone ($5.0B) exceeds the value currently being ascribed to the entire non-storage enterprise by the market, given our storage valuation.
4. The Rental Fleet: Fair Value vs. Book Value
4.1 Fleet Composition & Book Value
As of December 31, 2025, the rental fleet at gross cost consists of:
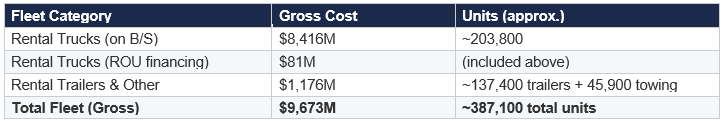
After accumulated depreciation (which we estimate at approximately $3.5-4.0 billion for the rental truck fleet based on the company’s accelerated depreciation schedule and the age distribution of the fleet), the net book value of the total fleet is approximately $5.5-6.0 billion.
The fair market value of the fleet depends heavily on used truck prices. During the pandemic-era boom (2021-2022), used truck values surged 30-50% above historical norms. They have since normalized and in some categories fallen below trend. Management has acknowledged that resale values on retired vehicles have been disappointing, which is why equipment gains have compressed. At current used vehicle pricing, we estimate the fair market value of the fleet is approximately equal to net book value, providing no material premium or discount. In a recovery scenario, the fleet could be worth $500M-$1B above book; in a downturn, it could be worth $500M-$1B below. We treat the fleet at net book value for NAV purposes, which is embedded in our Moving Business EBITDA valuation.
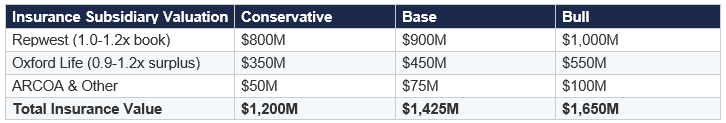
5. Insurance Subsidiaries: Hidden Balance Sheet Value
5.1 Repwest Insurance Company
Repwest underwrites property and casualty insurance products sold exclusively to U-Haul customers, primarily the Safemove, Safetow, and Safestor protection packages. This is a captive insurance model with several highly favorable characteristics:
AM Best affirmed Repwest’s Financial Strength Rating at A (Excellent) with a stable outlook in September 2025. The stable outlook reflects the expectation that Repwest will maintain its balance sheet strength while delivering favorable operating results.
Key financial data for Repwest (from the UHAL 10-K segment disclosures and AM Best reports):
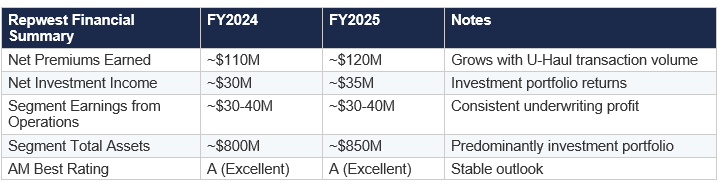
Source: UHAL 10-K segment disclosures (FY2024, FY2025); AM Best press release (September 19, 2025). Exact segment figures are estimated from reported segment revenue and earnings ranges due to intercompany eliminations.
Repwest’s valuation benefits from its captive status. The loss ratio is structurally low because U-Haul controls pricing and can adjust coverage terms. Customer acquisition cost is zero (policies are sold as add-ons to truck rentals). Combined ratio has historically been favorable. At 1.0-1.2x book value (typical for A-rated P&C companies with stable, specialized books), Repwest is worth approximately $800 million to $1.0 billion.
5.2 Oxford Life Insurance Company
Oxford Life is a multistate, multiline life insurance group focused on the senior market, offering multiyear guaranteed annuities, fixed annuities, final expense life insurance, and Medicare supplement products. It was founded in 1965 and has grown substantially under AMERCO/U-Haul ownership.
Oxford Life has over $3 billion in total assets (per its AnnuityAdvantage profile and AM Best ratings). AM Best rates Oxford at A (Excellent), though with a negative outlook as of September 2025 due to internal control deficiencies identified during the 2023 statutory audit. AM Best noted that these deficiencies are believed to have been fully remediated, pending confirmation in the 2024 audit opinion.
Key characteristics supporting valuation:
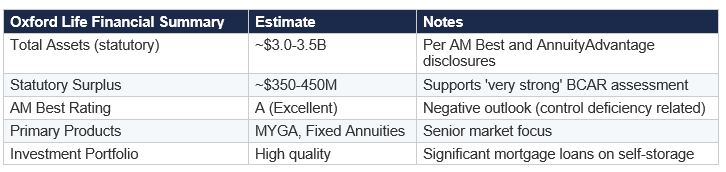
Life insurance companies with AM Best A ratings and $3+ billion in assets typically trade at 0.8-1.2x statutory surplus for annuity-focused companies. Oxford’s investment portfolio, which includes significant mortgage loans on self-storage facilities (a structural advantage given U-Haul’s direct knowledge of the underlying assets), supports a modest premium within this range.
6. Real Estate Holdings Beyond Self-Storage
U-Haul’s real estate is not limited to self-storage. The company owns approximately 2,300 company-operated moving centers and other facilities across North America. The land under these locations ($1.85 billion at gross historical cost as of December 2025) is carried at acquisition cost, which in many cases dates back decades. The buildings and improvements ($10.3 billion gross) include both storage facilities and operating centers.
To avoid double-counting with the self-storage valuation, we isolate the non-storage real estate by estimating that approximately 65-70% of the land and buildings relate to self-storage properties, with the remainder attributable to company-operated moving centers, repair shops, and administrative facilities.
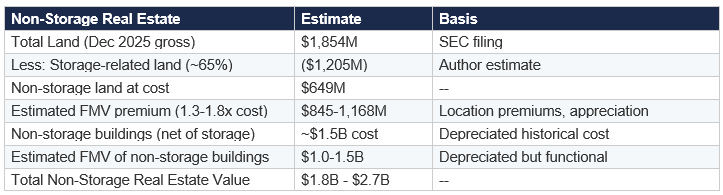
This is necessarily imprecise because U-Haul does not disclose which properties are storage versus non-storage. However, the key insight is that U-Haul owns an enormous amount of real estate beyond its storage business, much of it in high-visibility, high-traffic commercial locations (former big-box retail, highway-adjacent properties) that has appreciated well beyond its historical book value.
7. Balance Sheet: Liabilities & Net Debt
A thorough NAV analysis must account for the liabilities side. As of March 31, 2025:
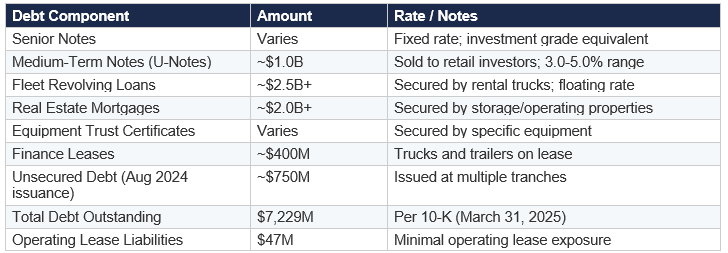
Source: UHAL 10-K (March 31, 2025): ‘As of March 31, 2025, we had total debt outstanding of $7,229.3 million and operating lease liabilities of $47.0 million.’ Debt component estimates from SEC filing analysis of notes payable schedules.
Offsetting the debt: cash and cash equivalents of $988.8 million (per 10-K), plus the Moving and Storage segment had approximately $1.35 billion in total cash and available credit (per Q3 FY2025 earnings commentary). Net debt is therefore approximately $6.2-6.3 billion.
The debt structure is predominantly fixed-rate and asset-backed, which limits refinancing risk and interest rate sensitivity. The fleet revolving loans are secured by specific truck assets, providing lenders with tangible collateral. The real estate mortgages are secured by the storage properties, which as we have demonstrated, are worth far more than their book values.
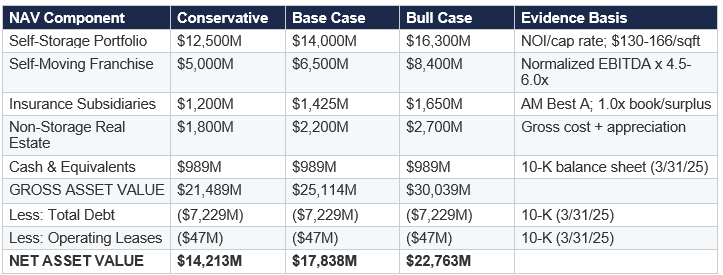
8. Consolidated NAV: The Complete Picture
Bringing together every component with the evidence established above:
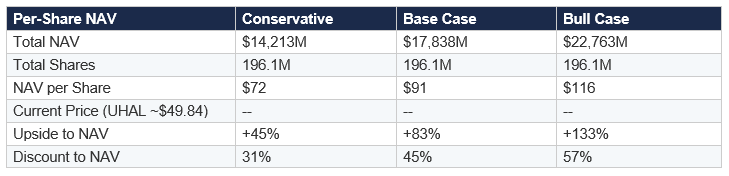
8.1 Per-Share NAV Calculation
U-Haul’s capital structure consists of 19,607,788 shares of Voting Common Stock ($0.25 par) and 176,470,092 shares of Series N Non-Voting Common Stock ($0.001 par), for a total of approximately 196.1 million shares. Both classes participate equally in economic value (undistributed earnings are allocated 10%/90% to voting/non-voting respectively, proportional to share count).
8.2 Sensitivity: What Has to Go Right (and Wrong)
For the stock to be fairly valued at $50, you need to believe: (a) the self-storage portfolio is worth only $9-10 billion (implying a 6.5%+ cap rate on current, pre-stabilization NOI), (b) the moving business deserves less than 4x normalized EBITDA (below Avis in a downturn), (c) the insurance subsidiaries and non-storage real estate are worth essentially nothing above the debt they carry, and (d) the development pipeline creates zero incremental value. This requires simultaneously pessimistic assumptions across every component.
For the stock to reach $90+, you need: (a) self-storage lease-up proceeds on the normal 24-36 month timeline, (b) cap rates remain in the 5.5-6.0% range (no compression needed), (c) fleet depreciation normalizes over the next 12-18 months as management has guided, and (d) the moving business returns to mid-cycle profitability. None of these are aggressive assumptions; they are the base case path of normal business execution.
9. Key Evidentiary Summary
This Part II has built the NAV case from the bottom up using only verifiable, sourced data:
PP&E Gross Cost: $22.9 billion at December 31, 2025, including $1.85 billion in land and $10.3 billion in buildings, per SEC-filed quarterly earnings supplements.
Self-Storage Revenue: $901 million in FY2025, growing 8% year-over-year, with an estimated trailing twelve-month run rate of ~$960 million, per company press releases.
Self-Storage Lease-Up Potential: $238 million in disclosed additional revenue from non-same-store stabilization, plus $253 million from development and pending pipeline, per management’s FY2025 investor presentation.
Cap Rates: Industry average of 5.8%, with Class A at 5.0-5.5% and Class B at 5.5-6.5%, per Cushman & Wakefield, SkyView Advisors, and Real Capital Analytics H1 2025 data.
Fleet Headwind Quantification: ~$260 million in combined excess depreciation and reduced equipment gains per management’s FY2025 earnings commentary; $500 million fleet capex reduction planned for FY2027.
Insurance Ratings: Both Repwest and Oxford Life rated A (Excellent) by AM Best as of September 2025, supporting valuations at or above book value.
Debt: Total debt of $7,229.3 million per the FY2025 10-K, predominantly fixed-rate and asset-secured. Cash of $988.8 million.
Insider Activity: Willow Grove Holdings LP (Shoen family vehicle) purchased 459,030 shares in September 2025 per SEC Form 4 filings. Consistent pattern of insider buying at current price levels over the past five years.
The evidence is clear: the market is pricing U-Haul Holding Company at a substantial discount to the value of its underlying assets. The passage of time, as storage properties lease up and fleet costs normalize, should progressively close this gap regardless of whether any discrete catalyst forces a re-rating.