
Tejon Ranch (TRC) | Part 2: NAV Deep Dive
50%+ NAV Discount | Asset-by-Asset Breakdown

1. TRCC INDUSTRIAL PORTFOLIO

1.1 Physical Description & Tenancy
The Tejon Ranch Commerce Center (TRCC) industrial portfolio is Tejon’s most mature, cash-generating asset. Through its 50/50 joint venture partnerships (primarily with Majestic Realty Co. and Rockefeller Group), the company has developed approximately 7 million square feet of Class A logistics and distribution facilities. An additional 11.1 million square feet of entitled industrial density remains undeveloped.
The portfolio is 100% leased as of Q3 2025. Anchor tenants include nationally recognized logistics operators and consumer goods companies: IKEA (distribution center), Caterpillar, Nestlé, Dollar General, Famous Footwear, and multiple third-party logistics providers. The 100% occupancy rate has been maintained consistently, a testament to the strategic location on I-5 between Los Angeles and the Central Valley.
1.2 Comparable Market Evidence
Rental Rate Comparables
California’s Central Valley is the most affordable major industrial market in the western U.S., but it is a rapidly growing one. According to CommercialCafe’s February 2026 national industrial report, in-place rents in California’s Central Valley average $6.80 per square foot. However, new lease premiums tell the more important story: leases signed in the last 12 months in the Central Valley averaged $8.78/SF - nearly $2.00/SF higher than in-place leases, representing the widest spread of any western U.S. market. This signals accelerating demand at the margins.
For context on where TRCC sits in the broader California industrial hierarchy:
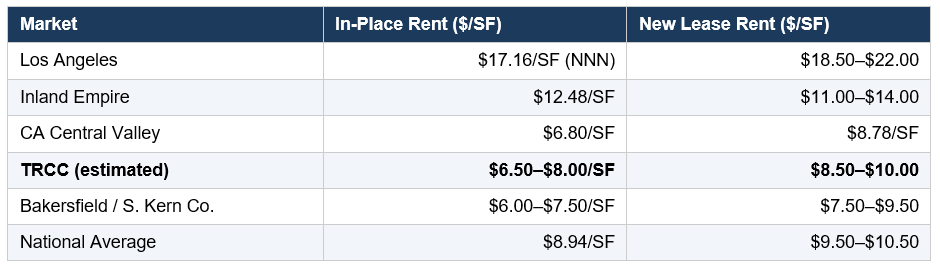
Sources: CommercialCafe Feb 2026 Industrial Report (national and Central Valley data); Kidder Mathews LA Industrial Q4 2025 (LA data); CBRE Inland Empire Q4 2025 (IE data); CoStar Q3 2025 (Bakersfield); ReadySpaces 2026 Warehouse Report (national). TRCC estimated based on company disclosures and regional positioning.
Cap Rate Comparables
Industrial cap rates nationally stood at approximately 6.2% in Q4 2025 per First American’s Potential Cap Rate model, with fundamentals supporting slightly lower levels. California industrial trades at a premium (lower cap rates) given supply constraints and proximity to the nation’s largest port complex:
• Los Angeles industrial: ~5.0–5.3% cap rate (Kidder Mathews Q4 2025)
• Inland Empire: ~5.6% cap rate (CBRE Q4 2025)
• National average industrial: ~6.0–6.2% (First American Q4 2025)
• National forecast for 2026: ~4.85–6.0% (Statista / First American)
• Central Valley / secondary CA: ~6.0–7.0% (estimated, reflecting secondary market positioning)
TRCC occupies a unique middle ground. Its location on I-5 provides superior logistics connectivity (two hours from the Port of LA, central to the entire state’s distribution network), but it is in Kern County, a secondary market. We apply a 5.75–6.75% cap rate range - below the national average (given California location and 100% occupancy) but above LA/IE levels (given Kern County positioning).
Land Value Comparables
Industrial land prices provide another valuation anchor. The company’s own investor presentations document a 1,500%+ increase in TRCC industrial land values from $0.57/SF in 2000 to approximately $9.00/SF today. External data corroborates this:
• Average industrial land in Kern County: ~$65,300 per acre (~$1.50/SF), per LandSearch aggregate data for all industrial parcels (includes raw, unimproved land)
• Entitled, infrastructure-served industrial land at I-5 locations: $6–12/SF, based on comparable lot sales in the Inland Empire and regional logistics corridors
• National industrial sale prices averaged $166/SF for built properties (CommercialCafe Jan 2026)
• LA industrial sales: $384.55/SF average, 5.3% cap rate (Kidder Mathews Q4 2025)
1.3 NAV Build-Up: TRCC Industrial
We derive value from two components: (a) the built and leased industrial portfolio, and (b) the remaining entitled land bank.
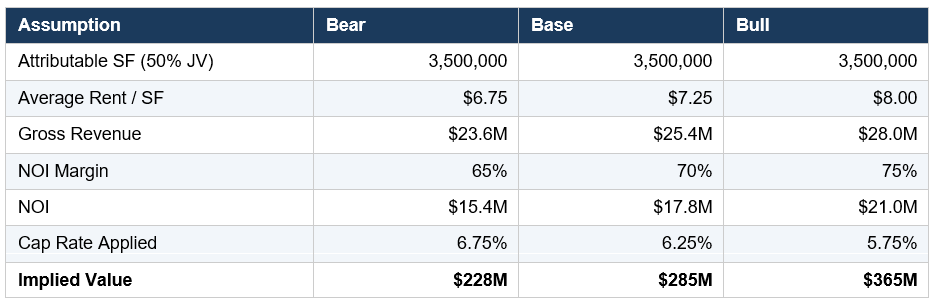
Component A: Built Industrial (7.0M SF at 50% JV share = ~3.5M SF attributable)
Estimating NOI: At ~$7.25/SF average rent (blended in-place and re-leased), 3.5M SF generates approximately $25.4M in gross rent. Applying a ~70% NOI margin (NNN leases with minimal landlord expense), NOI is approximately $17.8M.
Component B: Remaining Entitled Industrial Land (11.1M SF)
This represents one of the most valuable overlooked assets. 11.1 million square feet of entitled industrial density, fully infrastructure-served, in a 100% occupied park on a premier logistics corridor. At $9.00/SF (company-disclosed current land pricing), this land bank is worth approximately $100 million in its raw entitled state. We discount by 20–40% for execution risk and time:
TRCC Industrial Total: Bear $289M ($10.74/sh) | Base $368M ($13.68/sh) | Bull $471M ($17.51/sh)
Validation: The company disclosed TRCC alone contributed a NAV of $14.65–$20.11/share in its 2025 investor presentation. Our range of $10.74–$17.51/share for just the industrial component is consistent, since it excludes the retail, residential, and travel center components addressed separately.
2. TRCC RETAIL / OUTLETS AT TEJON
2.1 Asset Description
The Outlets at Tejon is an approximately 674,000 SF open-air outlet shopping center, 95% occupied, located directly on I-5 with approximately 20,000 vehicles exiting per day at the TRCC interchange. Tenants include Nike Factory Store, Polo Ralph Lauren, Tommy Hilfiger, Kate Spade, Coach, and other nationally recognized retail brands. An additional 282,000 SF of entitled retail space remains.
2.2 Comparable Evidence
Outlet center valuations have been under pressure since the pandemic, but well-located, high-traffic highway outlets with strong tenant rosters retain value. Key comparables:
• Tanger Outlets (SKT) trades at an implied cap rate of approximately 7.0–8.0% as a publicly traded outlet REIT
• Premium Outlets portfolio transactions have occurred at 6.5–8.5% cap rates depending on location and occupancy
• Tejon’s unique advantage: sole retail stop on a 90-mile stretch of I-5 between LA and Bakersfield, creating a near-monopoly on highway-adjacent retail traffic
• Hard Rock Casino Tejon ($600M facility opened November 2025), located less than 15 miles away, is generating substantial incremental traffic; the casino paid $10 million in jackpots in its first 10 days of operation, indicating very high initial foot traffic
2.3 NAV Build-Up
Estimating NOI at ~$15–18/SF for outlet center rents (below LA/IE outlet levels, reflecting secondary location), 95% occupancy on 674,000 SF:
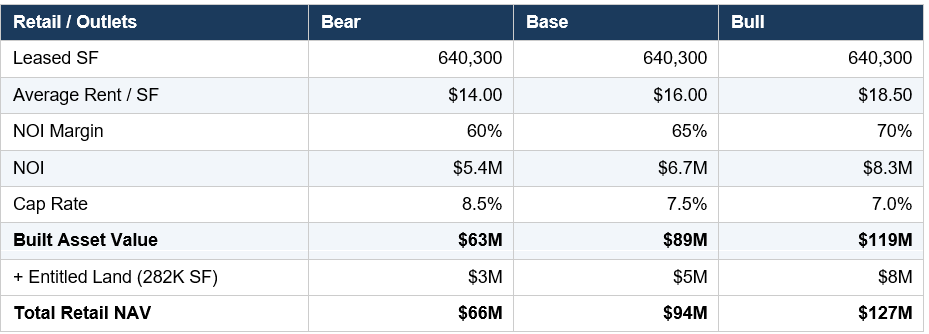
Retail Total: Bear $66M ($2.45/sh) | Base $94M ($3.49/sh) | Bull $127M ($4.72/sh)
3. TERRA VISTA APARTMENTS & TRAVEL CENTER
3.1 Terra Vista Multifamily
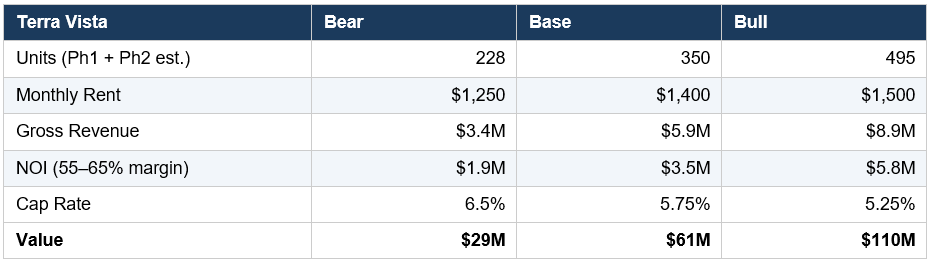
Terra Vista at Tejon is TRCC’s first residential community, with 228 units delivered in Phase 1 (spring 2025) and entitlements for up to 495 total units. As of Q3 2025, 55% of delivered units were leased - a healthy absorption rate for a brand-new community in a secondary market. The apartments serve the ~5,000 industrial employees at TRCC and the growing Bakersfield/Kern County labor market.
Multifamily Comparable Evidence
• LA Class A multifamily: 4.3–4.7% cap rate (CBRE Q4 2025)
• Inland Empire multifamily: ~5.3% cap rate (CBRE Q4 2025)
• Secondary CA / Kern County multifamily: ~5.5–6.5% estimated, reflecting higher yields in non-coastal markets
• Average apartment rents in Bakersfield/Kern County: approximately $1,200–1,500/month for newer product
3.2 TA/Petro Travel Center (60% TRC Ownership)
The travel center joint venture (60% TRC / 40% TravelCenters of America) is one of the busiest in California, capturing traffic from ~100,000 vehicles per day on I-5. This asset has paid $45 million in cash distributions over a recent five-year period, implying ~$9 million/year in distributions to the partnership, of which TRC’s 60% share is ~$5.4 million annually.
Travel center valuations typically range from 8–12x cash flow depending on location, brand strength, and traffic patterns. At 10–12x TRC’s share of distributions:
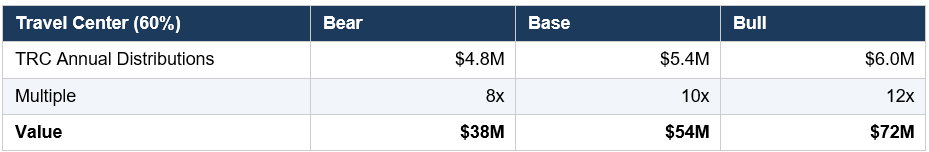
Terra Vista + Travel Center Total: Bear $67M ($2.49/sh) | Base $115M ($4.28/sh) | Bull $182M ($6.77/sh)
4. WATER RIGHTS & INFRASTRUCTURE
4.1 The Asset
Tejon Ranch holds 142,000–148,000 acre-feet of water through a combination of State Water Project (SWP) entitlements under long-term contracts and banked water stored in on-ranch and off-ranch water banks. Thirty miles of the California Aqueduct - the primary conduit transporting water from Northern to Southern California - run directly through the ranch, providing both sourcing and delivery infrastructure.
The water portfolio serves a dual purpose: it provides the future supply for all planned MPC developments, and it generates interim income through temporary right-of-use leases to third parties (averaging ~$2.4 million/year net over a five-year period). Critically, Tejon does not sell its permanent water rights - only temporary usage, preserving the underlying asset.
4.2 Comparable Pricing Evidence
Water pricing in California is complex and varies enormously by source, geography, seniority of rights, and end use. Key data points:
• Urban water agencies in California pay an average of ~$722 per acre-foot for surface water (UCLA/NRDC December 2025 report)
• Agricultural water districts in Kern County pay significantly less: SWP delivery costs average ~$250/AF in the San Joaquin Valley
• Replenishment fees in groundwater-stressed basins range from $1,700/AF (Antelope Valley-East Kern) to $2,130/AF (Indian Wells Valley), per 2024 California appellate court rulings
• SWP water costs to Southern California contractors average ~$600/AF and can exceed $1,400/AF on the Central Coast
• Stormwater conservation alternatives cost $600–$5,000/AF with a median of $2,100/AF; turf removal programs cost $420–$1,500/AF with a median of $1,100/AF (California DWR)
• Permanent water transfer prices in high-demand basins: $2,000–$10,000+ per AF, depending on senior rights status and location
4.3 Valuation Approach
We value Tejon’s water portfolio on a blended basis reflecting three components: (1) the present value of interim cash flow from temporary leases, (2) the strategic value as development input for its own MPCs, and (3) the optionality value as a long-term scarce California asset.
The most conservative approach values water only by its cash-generating capacity. At $2.4M/year, discounted at 8% in perpetuity, this yields $30M. But this dramatically understates reality because the water’s highest and best use is as an input to residential development where it enables each home sale. Water for a developed residential lot in California can represent $10,000–30,000+ of embedded value per home. Across 35,000 planned homes, water enables $350M–$1B+ of real estate value creation.
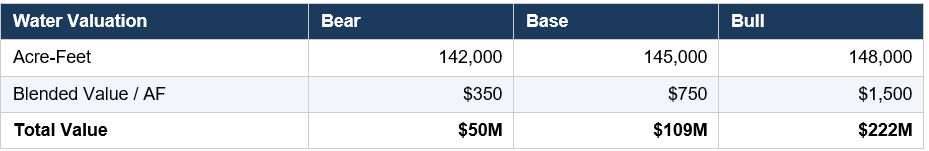
Bear case uses only capitalized lease income plus modest strategic premium. Base case reflects the replacement cost of equivalent SWP water in a constrained system. Bull case reflects long-term scarcity pricing for permanent California water positions, still well below comparable permanent transfer prices of $2,000–$10,000+/AF.
Water Total: Bear $50M ($1.86/sh) | Base $109M ($4.05/sh) | Bull $222M ($8.25/sh)
5. PASTORIA ENERGY LEASE & MINERAL RESOURCES
5.1 Pastoria Energy Center Ground Lease
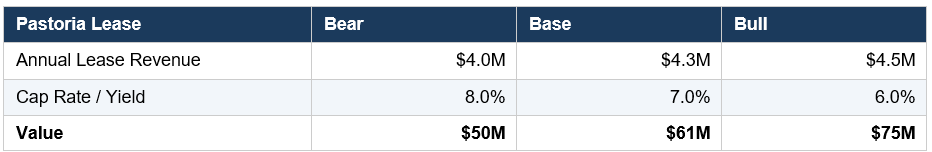
The 750 MW Pastoria Energy Facility is a natural gas-fired, combined-cycle power plant owned and operated by Calpine Corporation (now a subsidiary of Energy Capital Partners following its 2018 take-private). Built in 2001–2005 on land leased from Tejon Ranch, the facility was commissioned in July 2005. The ground lease generates $4+ million in annual revenue to Tejon Ranch, with CPI escalation.
Why This Asset Matters Beyond Its Cash Flow
• 750 MW of existing grid interconnection capacity on Tejon’s land - this is enormously valuable in an era when interconnection queue times for new generation average 4–7 years nationally
• Calpine has also developed plans for industrial-scale solar on adjacent land, signaling recognition of the site’s broader energy potential
• Premium Energy Holdings has proposed a $2–3 billion pumped hydro energy storage project (1,000 MW) connected to the California Aqueduct on/near Tejon Ranch, capable of storing 3,500 GWh/year
• The power plant site demonstrates the “gatekeeper” value of Tejon’s position: anyone who needs to generate or transmit power between Northern and Southern California must engage with TRC
5.2 Mineral Resources
The mineral resources segment generates steady, low-capital-intensity royalty income from multiple sources:
• Oil and gas royalties from production leases across the ranch
• Rock and aggregate royalties
• Cement royalties from National Cement Company of California, which produces more than 23 million cubic yards of cement from its limestone mining lease on the ranch
• Combined mineral + commercial ground lease revenues (excluding Pastoria) average approximately $7 million per year (company disclosure)
Mineral royalties are among the most attractive revenue streams in real estate - they require virtually no capital expenditure, carry no operating risk, and provide inflation-linked income. At a 7–9% capitalization rate:
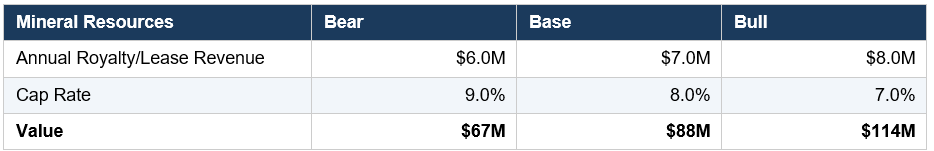
Pastoria + Minerals Total: Bear $117M ($4.35/sh) | Base $149M ($5.54/sh) | Bull $189M ($7.03/sh)
6. MASTER PLANNED COMMUNITIES
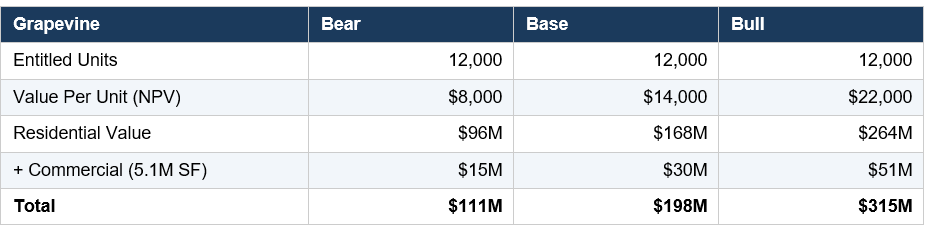
6.1 Grapevine at Tejon Ranch
Grapevine is the nearest-term residential MPC and arguably the most de-risked after Terra Vista. Kern County Board of Supervisors unanimously approved it (5-0) in 2016 and reaffirmed approval (5-0) in 2019 after supplemental environmental analysis addressed traffic impact concerns. The project encompasses 8,010 acres with 4,200 developable and 3,800 designated open space.
Valuation Evidence
• 12,000 residential units + 5.1M SF commercial across six mixed-use villages over 20 years
• Adjacent to TRCC, which provides established employment base, infrastructure, and economic momentum
• Hard Rock Casino (15 miles south) creating incremental regional employment and economic activity
• Comparable entitled residential lot values in California secondary markets: $20,000–$60,000 per lot for bulk entitled land sales to homebuilders
• CoStar’s Q3 2025 analysis identified Bakersfield as one of only four CA logistics markets expected to see positive growth through 2026, signaling economic vitality in the immediate area
• Kern County, despite its secondary-market status, is one of the fastest-growing counties in California by job and population growth over the past decade (company’s investor presentation data)
We value Grapevine on a per-entitled-unit basis, discounted for time to build-out (20 years) and execution risk. Comparable California MPC lot sales to homebuilders typically range from $25,000 to $80,000 per lot for bulk purchases of improved lots. Entitled but unimproved land sells at a steep discount - typically 25–50% of improved lot value.
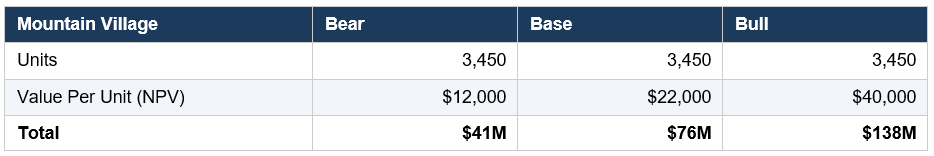
6.2 Mountain Village
Mountain Village is a 3,450-unit luxury residential and resort community planned for the western high country of the ranch near Lebec. It has Kern County entitlements and is in the tract map preparation stage. The resort orientation (equestrian, outdoor recreation, mountain living) targets a higher-income buyer profile than Grapevine. We value at a premium per unit but apply a higher time discount:
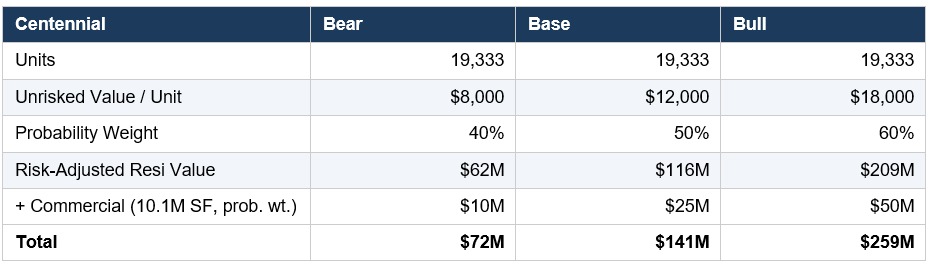
6.3 Centennial at Tejon Ranch
Centennial is the largest project (19,333 units, 10.1M SF commercial on 12,000 acres in LA County) and carries the most risk following the June 2025 Court of Appeals decision that rescinded the project’s 2019 approvals. Management is pursuing re-entitlement through supplemental environmental analysis, targeting a new LA County Board action by late 2026.
Key mitigating factors: the company prevailed on 20 of 23 claims at trial; the deficiencies are narrow (GHG analysis and off-site wildfire risk); the project already negotiated a Net Zero GHG settlement with Climate Resolve; and California’s housing crisis creates strong political tailwinds for a project delivering 19,333 units including 3,480+ affordable.
We apply a 40–60% probability weighting to reflect re-entitlement risk:
Total MPCs: Bear $224M ($8.33/sh) | Base $415M ($15.43/sh) | Bull $712M ($26.47/sh)
Sensitivity: if Centennial is fully de-risked (100% probability, post re-entitlement), the MPC total increases by $70–175M+ depending on scenario. This is the single largest source of upside optionality in the TRC thesis.
7. FARMING, RANCH OPERATIONS & ENERGY OPTIONALITY
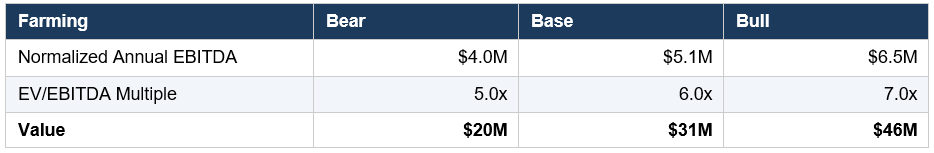
7.1 Farming Operations
Tejon’s farming segment cultivates almonds, pistachios, wine grapes, olives, and hay on irrigated acreage within the ranch. The company also leases farmland for vegetable and almond production. Over a 12-year period, the segment generated $61.3 million in adjusted EBITDA at a 21% margin (company disclosure from CEO’s November 2025 letter).
Farming is inherently cyclical - the 2024 pistachio crop failed due to insufficient chill hours, while 2025 saw a strong almond recovery (+34% Q3 revenue YoY). We value farming as a going-concern cash flow stream at a conservative multiple:
7.2 Ranch Operations & Conservation Land
240,000 acres are permanently conserved under the 2008 agreement. These lands generate modest income from grazing leases, game management, and filming while serving the strategic purpose of providing environmental and social license for the development of the remaining 10% of the ranch. Ranch operations also include various auto service stations, fast-food leases, and miscellaneous land uses.
We assign a nominal value of $100–250 per acre for the conservation and ranch lands, reflecting grazing lease capitalization and the strategic value of the conservation framework to the development pipeline. At 240,000 acres: $24M–$60M.
7.3 Energy & Infrastructure Optionality
This is the most speculative component but potentially the highest-impact. The ranch’s energy infrastructure - 750 MW power plant, high-voltage transmission, California Aqueduct, fiber backbone - positions it as a potential site for:
• Utility-scale solar (thousands of flat, sun-drenched acres adjacent to existing grid interconnection)
• Battery energy storage (leveraging existing grid connection points)
• Pumped hydro energy storage (Premium Energy’s 1,000 MW / 3,500 GWh proposal connected to the Aqueduct)
• Data center campus development (power + water + fiber + land + proximity to LA)
We assign a probability-weighted optionality value rather than attempting to capitalize a specific revenue stream. A single data center ground lease could generate $10–30M+ annually; a 200 MW solar farm might yield $3–5M/year. We value the option at $15–75M, representing a modest probability-weighted estimate of what could ultimately become a multi-hundred-million-dollar asset class.
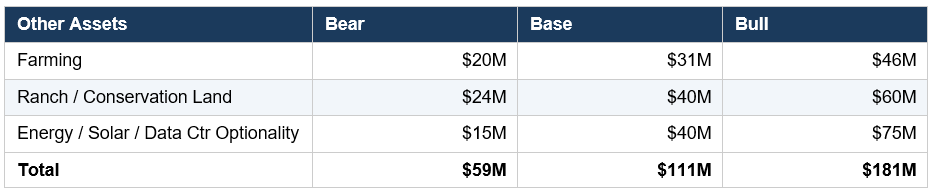
Farming + Ranch + Energy Total: Bear $59M ($2.19/sh) | Base $111M ($4.13/sh) | Bull $181M ($6.73/sh)
8. CONSOLIDATED NET ASSET VALUE

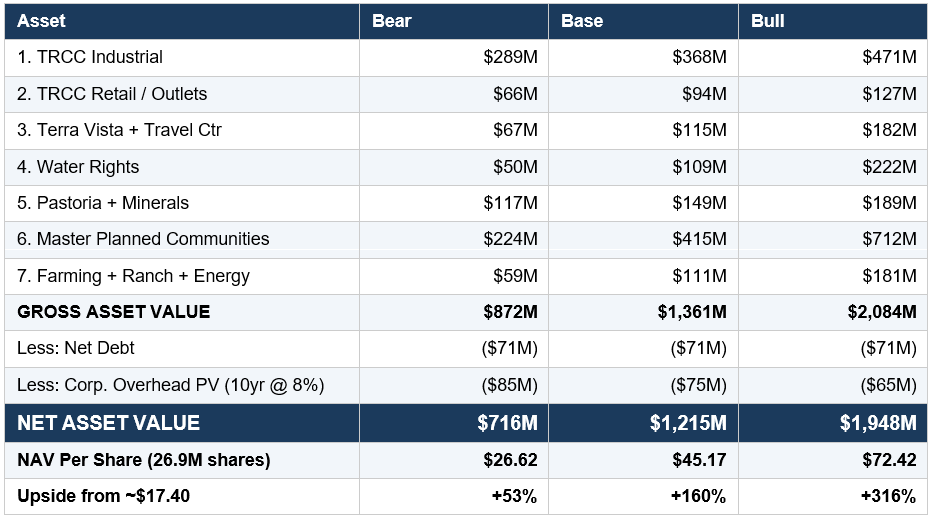
8.1 Time-Adjusted NAV
Applying a 30% blanket time/liquidity discount to the base case midpoint:
Adjusted Base NAV: $45.17 × 0.70 = $31.62/share → +82% upside from current price
Even the most punitive scenario - bear case NAV with a 40% time/liquidity discount - yields $15.97/share, providing downside support near the current price:
Floor NAV: $26.62 × 0.60 = $15.97/share → roughly 8% downside from current price
This asymmetry is the essence of the investment thesis: ~8% downside to a heavily discounted bear case vs. 82–316% upside across the base and bull scenarios. The risk/reward skew is highly attractive for patient capital.