
Seaport Entertainment Group (SEG) | Part 2: NAV Deep Dive
Asset-by-Asset with Stress-Tested Cap Rates

In Part 1 of this thesis, we applied cap rates of 5.5% to 7.0% to the Seaport district’s stabilized NOI. The cap rate is the single most levered assumption in any real estate NAV analysis, and in this case, it deserves particular scrutiny because the Seaport’s tenant roster does not necessarily resemble the institutional-quality credit profiles that justify sub-7% caps in Manhattan.
This revision recalibrates the entire NAV framework around a more honest assessment of tenant quality, operating risk, and the gap between the Seaport’s physical irreplaceability and the actual creditworthiness of the entities writing the rent checks. The thesis still works. But it works for different reasons than a naive cap rate compression story would suggest, and the margin of safety calculation changes meaningfully.
Asset 1: The Seaport District - Lower Manhattan (Revised)

1.1 An Honest Assessment of Tenant Quality
Before we calculate anything, we need to confront the tenant roster head-on, because this is where the bull case for a trophy Manhattan cap rate falls apart.
Tenant Credit Assessment
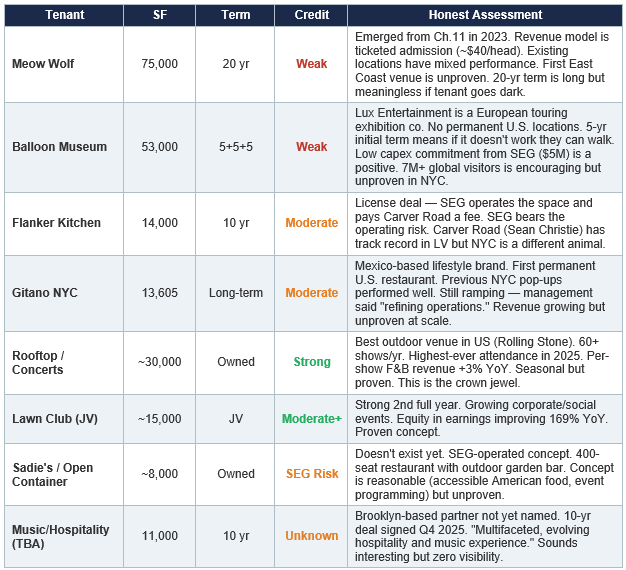
Brooklyn-based partner not yet named. 10-yr deal signed Q4 2025. “Multifaceted, evolving hospitality and music experience.” Sounds interesting but zero visibility.
The picture is clear: this is not Vornado leasing to Nike and Bloomberg. Two of the largest tenants by square footage (Meow Wolf and Balloon Museum) have genuinely questionable credit profiles. Several other spaces are operated by SEG itself, meaning the company bears direct operating risk rather than collecting contractual rent from creditworthy third parties. The Rooftop concert series and Lawn Club are the strongest performers, but they are seasonal and weather-dependent.
A portfolio with this credit profile, regardless of how irreplaceable the location is, does not warrant a sub-7% cap rate. Trophy location, yes. Trophy tenants, no. The location is the Champs-Elysees. The tenant roster is a Williamsburg pop-up market. You have to price both sides of that equation.
1.2 Revised Cap Rate Framework
We recalibrate to a range of 6.5% to 10.0%, with a base case of 7.5%. Here is the logic for each scenario:
Bear Case (10.0%): This treats the Seaport as a high-risk, experiential entertainment venue with weak tenant credit, operational complexity (SEG self-operates many concepts), seasonal revenue concentration, and a location that has historically underperformed relative to its physical beauty. A 10% cap rate is appropriate for secondary-market entertainment real estate or for assets with significant lease-up and execution risk. It is arguably harsh for Manhattan waterfront, but it reflects the reality that if Meow Wolf goes dark and Balloon Museum doesn’t renew after five years, a significant portion of the income stream evaporates.
Base Case (7.5%): This is a blended rate that gives appropriate credit to the irreplaceable location, the 20-year Meow Wolf term (even with credit risk, the long duration has value), the Rooftop concert venue’s proven track record, and the stabilization progress. But it also penalizes for the weak tenant credit, the operational risk of self-operated concepts, and the ongoing capex requirements. At 7.5%, you’re paying a premium to generic entertainment real estate for the Manhattan waterfront location, but not pretending these are investment-grade tenants.
Bull Case (6.5%): This becomes appropriate only if the tenant base proves out over the next 18 to 24 months. If Meow Wolf opens and draws 1 million+ visitors annually, if Balloon Museum’s U.S. flagship performs at or above its European benchmarks, and if the concert series and event space expansion deliver the 20%+ returns management projects, then the income stream starts to look durable and diversified enough to justify a cap rate approaching institutional Manhattan entertainment real estate. This is a future state, not today’s reality.
1.3 Stabilized EBITDA Build-Up (Unchanged)
The income estimate itself does not change. The EBITDA build-up is anchored in disclosed leases, management guidance, and observable revenue streams. What changes is the multiple we pay for that income.
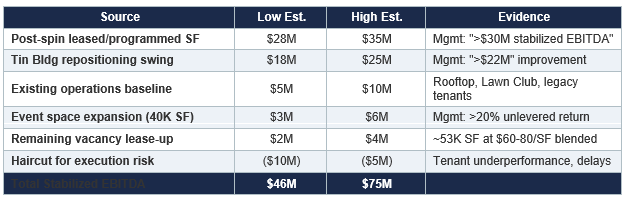
We apply a separate haircut of $5 to $10 million in the EBITDA estimate itself to account for execution risk: tenants that open late, concepts that underperform initial projections, or periods of elevated vacancy during transitions. This is in addition to using a higher cap rate, so we are double-penalizing for risk. That is intentional. We want a valuation that survives scrutiny from a skeptic, not one that requires everything to go right.
1.4 Revised Seaport Valuation
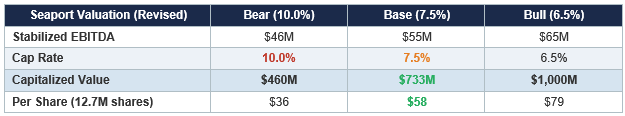
The critical observation: even at a 10% cap rate, which treats the Seaport like a secondary-market entertainment complex with no location premium whatsoever, the district is worth $460 million. That is still nearly three times the current enterprise value of approximately $170 million. The Seaport alone, valued as harshly as we can reasonably justify, still covers the entire stock price with room to spare.
This is why the thesis works even with honest cap rates. You are not buying the Seaport at a 6% cap and hoping the math holds. You are buying it at an implied 10%+ cap and getting every other asset for free. The margin of safety comes from the entry price, not from optimistic assumptions.
1.5 Replacement Cost as a Valuation Floor
Howard Hughes invested approximately $785 million in the Seaport redevelopment, with total Seaport-related capital deployment reaching the $1.5 billion figure cited by industry sources when including acquisitions and ongoing investment. Pier 17 alone was a $200 million+ reconstruction designed by SHoP Architects that required complete demolition and rebuilding of the pier structure in the East River. The Tin Building underwent a $200 million+ renovation completed in 2022. To replicate these structures today, at Manhattan construction costs of $800 to $1,200 per square foot for high-quality waterfront commercial buildings, would cost $600 to $900 million for the physical plant alone, before any land or pier infrastructure costs.
Even our bear-case cap rate valuation of $460 million represents a 40% to 50% discount to replacement cost. This is not aggressive. It is punitive. And the stock is trading at a level that implies an even deeper discount.
1.6 The Tin Building Repositioning: Why It Is the Hardest Data Point
The Tin Building swing deserves specific emphasis because it is the most concrete, least speculative number in the entire analysis. Management disclosed a pro forma annual EBITDA improvement of more than $22 million from the replacement of the Tin Building culinary operations with the Balloon Museum lease. This is not a projection based on foot traffic estimates or revenue per visitor assumptions. It is the difference between a contractual lease obligation (with base rent, escalations, and percentage rent) and an operating loss that was burning $12 to $15 million annually.
Even if you are skeptical about Balloon Museum’s long-term viability (and a 5-year initial term gives them limited commitment), the immediate EBITDA impact is real: the cash burn stops the day the Tin Building closes, and the lease income begins when Balloon Museum opens. If Balloon Museum fails and leaves after five years, SEG has a 53,000 square foot landmarked waterfront building that can be repositioned again, this time with a proven playbook and no legacy $200 million renovation overhang.
Asset 2: Las Vegas Ballpark and the Aviators
2.1 Construction Cost and Physical Asset
The Las Vegas Ballpark was completed in 2019 at a cost of approximately $150 million. It is a 10,000-capacity facility in Summerlin, one of the fastest-growing master planned communities in the western United States. The ballpark secured an $80 million naming rights deal with the Las Vegas Convention and Visitors Authority over 20 years, beginning in 2019. The present value of the remaining naming rights stream (approximately 13 years at roughly $4 million annually, discounted at 6%) is $45 to $52 million. The facility carries approximately $39 million in pro forma debt maturing in 2038.
Replacing this ballpark today, given 30% to 40% construction cost inflation since 2019, would cost $195 to $210 million. The facility is seven years old and in excellent condition.
2.2 Franchise Valuation Evidence
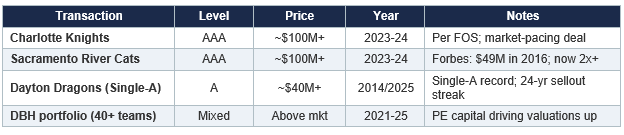
Minor league baseball franchise values have inflected sharply upward. Front Office Sports reported in March 2025 that recent Triple-A team transactions in Charlotte and Sacramento have approached or surpassed $100 million. Diamond Baseball Holdings, the private equity vehicle that has acquired over 40 MiLB teams since 2021, has been purchasing at above prior market rates according to Baseball America. Forbes valued the Sacramento River Cats at $49 million in 2016; comparable franchises are now trading at 2x to 3x that level.
The Aviators benefit from several differentiating factors: a brand-new facility (most MiLB teams play in aging stadiums); the Las Vegas market with its tourism base and population growth; affiliation with the Oakland Athletics, who are building a new MLB stadium on the nearby former Tropicana site, which will increase baseball visibility in the market; the 2025 PCL Championship; Savannah Bananas guest appearances that are outselling 2024 levels; and the Enchant holiday activation providing year-round revenue diversification.
Comparable MiLB Transaction Evidence
2.3 Combined Valuation
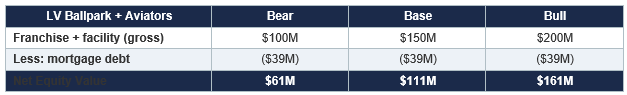
CEO Partridge stated on the FY2025 earnings call that management would expect a “pretty high premium” on the team and ballpark if a buyer approached. Live sports franchise values have consistently appreciated, and the entry of private equity into MiLB has created a secular uplift in valuations across the tier. Even in the bear case, this asset is worth more than a third of the current enterprise value - and the market assigns it zero.
Asset 3: Fashion Show Mall Air Rights (80% Interest)
Anchoring to Developed-Asset Comparables
The Cosmopolitan of Las Vegas, built on approximately 8.7 acres of the Strip, was sold by Blackstone for $5.65 billion in 2021. Blackstone had purchased it for $1.7 billion in 2014, invested $500 million in renovations, and created one of the most successful casino-resort operations on the Strip. Even attributing just 10% of the Cosmopolitan’s sale price to its underlying land value implies approximately $65 million per acre. Fashion Show’s 34 acres, at a fraction of this figure, would be worth hundreds of millions.
To be clear, we are not arguing that undeveloped air rights are equivalent to a fully operational 3,033-room casino resort. The comparison illustrates the magnitude of value that can be created on a relatively small Strip footprint with the right development and operator. The air rights are a call option on that potential, and call options have value even when they are deeply out of the money.
At even the bear-case value of $143 million, SEG’s 80% interest in the Fashion Show air rights alone is worth roughly 85% of the current enterprise value. This is an asset the market assigns zero value to, sitting on the most constrained entertainment development corridor on Earth.
Asset 4: Jean-Georges Restaurants (25% Stake)
SEG holds a 25% ownership interest in Jean-Georges Restaurants, acquired by Howard Hughes for $45 million. The group operates approximately 60 restaurants across 12 countries, anchored by the three-Michelin-star flagship Jean-Georges in New York and spanning concepts from ABC Kitchen to Nougatine to international hotel restaurant partnerships.
Celebrity chef restaurant groups are difficult to value precisely because their economics blend owned-location cash flows, management fees, licensing revenue, and brand equity. Comparable platforms include Wolfgang Puck Fine Dining Group (estimated $400 to $500 million EV), Nobu Hospitality (valued at over $500 million before its hotel expansion), and the Thomas Keller Restaurant Group. Jean-Georges, with the distinction of three Michelin stars and a 60+ location global footprint, sits in the upper tier.
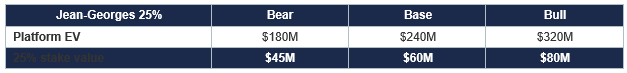
We conservatively value the entire platform at $200 to $300 million, yielding a 25% stake value of $50 to $75 million. This represents 1.1x to 1.7x the acquisition cost - modest appreciation for a brand that has grown its global footprint significantly since acquisition. The ongoing Lawn Club JV performance (equity in earnings up 169% YoY) demonstrates continued commercial viability.
Asset 5: 85 South Street Residential (21 Units)
SEG owns a 21-unit apartment building at 85 South Street, nearly 100% occupied with a mix of market-rate and rent-stabilized units. Management initiated a sale process in late 2025 and described strong buyer interest on the Q4 2025 earnings call. Comparable Lower Manhattan multifamily transactions suggest $900,000 to $1.4 million per unit, or $19 to $29 million total. The rent-stabilized component constrains value but the waterfront-adjacent location in a rapidly improving neighborhood provides a floor.

What Gets You to the Current Enterprise Value?
At an enterprise value of approximately $170 million, the market is implying one of two things: either the Seaport stabilizes at approximately $17 million in EBITDA (less than half of management’s guided $30 million from post-spin leases alone, before the $22 million Tin Building swing) capitalized at a 10% cap rate, with every other asset worth zero; or the Seaport never stabilizes, every tenant fails, and the company is worth its net cash of $124 million plus some residual scrap value. The first scenario requires the Meow Wolf lease, the Balloon Museum lease, the Flanker license, Gitano, Sadie’s, the event space expansion, and the concert series to collectively produce less than half of what management has projected. The second scenario requires a comprehensive failure of the entire operating platform. Both are possible. Neither is probable.
The Structural Reasons the Mispricing Persists
Orphaned spinoff: Howard Hughes shareholders were REIT and MPC investors. They received SEG shares in a pro rata distribution and sold without analysis. Pershing Square (38%) is the only large holder with a thesis.
No earnings, no screens: SEG reported a $116.7 million net loss in FY2025. It does not screen on any traditional metric. Quantitative funds and value screens filter it out. The company is invisible to 95% of institutional capital.
No float: With 12.7 million shares outstanding and 38% held by Pershing, the public float is roughly $180 million. Most institutional mandates require minimum market caps of $500 million or higher and minimum daily trading volumes that SEG does not meet.
Category orphan: SEG is not a REIT, not a pure-play entertainment company, not a restaurant company, and not a sports franchise. It does not fit cleanly into any analyst coverage universe or industry ETF. No one owns it because no one knows where to put it.
No GAAP earnings path visible: Depreciation on $1.5 billion of historical investment creates massive GAAP losses that will persist for years regardless of cash flow improvement. Investors who screen on P/E will never find this stock.
These structural barriers are temporary. The NYSE uplisting and Russell 2000 inclusion were first steps. As EBITDA turns positive, as the Seaport stabilizes, and as the company gains analyst coverage, the investor base will broaden and the discount will narrow. The question is not whether the mispricing will correct, but when and how fast.