
Rexford Industrial (REXR) | Part 1: Irrationally Discounted from Private Market Value
30%+ NAV Discount on SoCal Infill Industrial with High Barriers-to-Entry

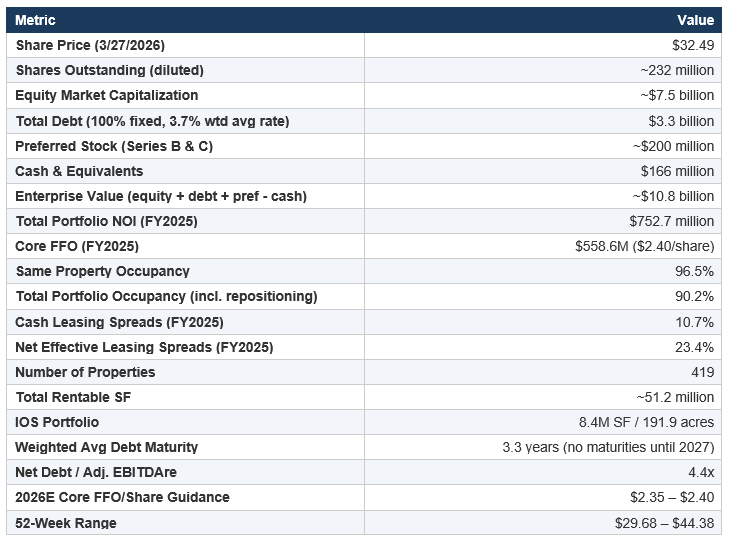
Rexford Industrial Realty (NYSE: REXR) is a pure-play Southern California infill industrial REIT that owns and operates 419 properties comprising approximately 51.2 million rentable square feet across the highest-barrier-to-entry industrial market in the United States. The stock trades at approximately $33 per share as of late March 2026, implying a market capitalization of roughly $7.6 billion and an enterprise value of approximately $10.8 billion after adding $3.3 billion in net debt.

Our analysis constructs a bottom-up Net Asset Value on the portfolio using conservative cap rates derived from private market transaction data, stress-tests the NAV under recession and rising-rate scenarios, and evaluates the embedded optionality in the company’s repositioning pipeline, industrial outdoor storage (IOS) assets, and land holdings. The core finding is that the market is pricing the stabilized portfolio at an implied cap rate of approximately 7.0%, a level that bears no relationship to private market clearing prices for infill SoCal industrial, which have consistently traded at 4.0–5.5% cap rates over the past two years. Even under punitive stress assumptions - a 6.0% cap rate across the entire portfolio - the stock appears meaningfully undervalued relative to private market value.
At the current price, the market is effectively assigning zero value to approximately $1.5–2.5 billion in identifiable asset categories including the repositioning/development pipeline, the IOS portfolio, mark-to-market rent upside embedded in below-market leases, and the platform value of the only publicly traded REIT exclusively focused on Southern California infill industrial.
Snapshot: Key Financial Data (FY2025)
THE BUSINESS: WHY REXFORD IS STRUCTURALLY DIFFERENT
Rexford Industrial is the only publicly traded REIT exclusively focused on the Southern California infill industrial market. This is not a geographic preference - it is a structural moat. The SoCal industrial market is the fourth-largest industrial market in the world by square footage, yet it has the lowest vacancy rate and highest barriers to new supply of any major U.S. industrial market. The region’s entitlement and permitting regime, environmental regulations, and land scarcity make meaningful new supply functionally impossible in most infill submarkets.
 | Seeking Alpha")
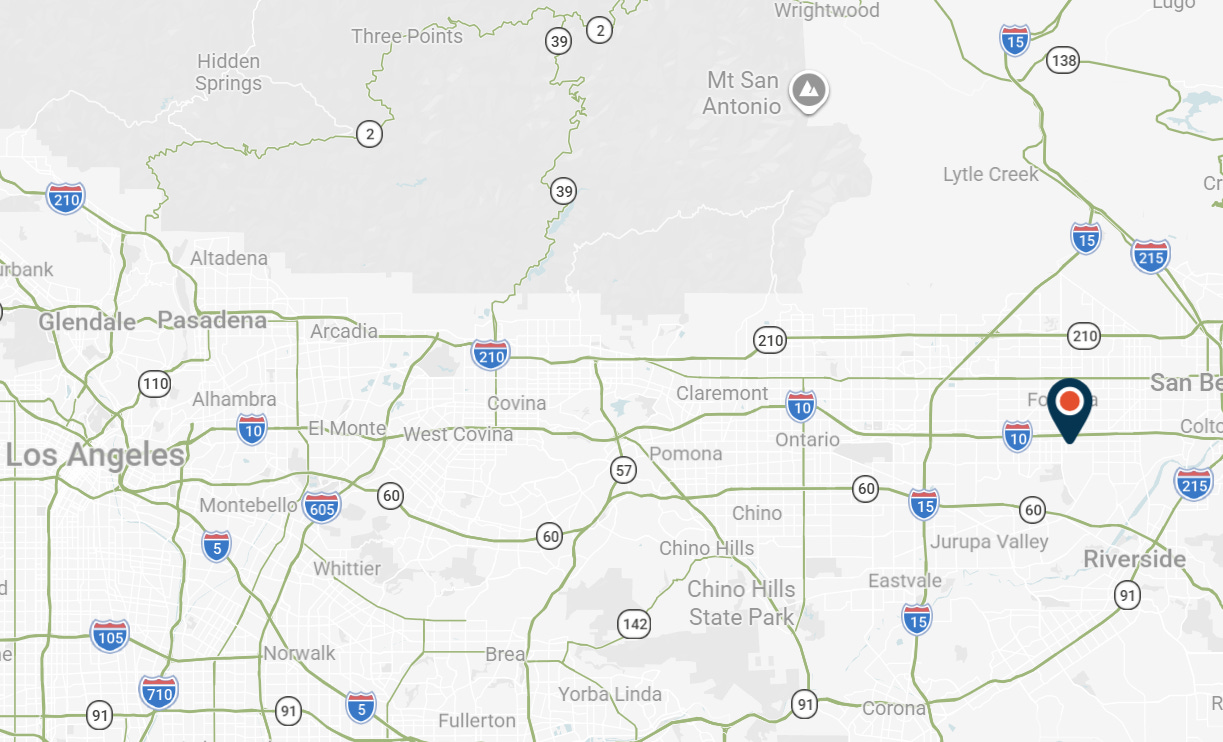
The portfolio is distributed across Los Angeles County, Orange County, San Diego, Ventura, and the Inland Empire - West, with the heaviest weighting in the most supply-constrained coastal and infill submarkets. The company operates predominantly in the small- to mid-bay segment (buildings under 200,000 SF), which serves a fragmented tenant base of over 1,500 tenants and is less exposed to the large-format logistics space where vacancy has normalized.
Market Context: Cyclical Softness, Structural Scarcity
The SoCal industrial market has experienced a correction from the pandemic-era frenzy of 2021–2022. Market rents in Los Angeles are down approximately 22–31% from peak levels, depending on submarket and building class. Overall vacancy in LA has risen to approximately 4.3–5.8% (depending on source), up from sub-2% at peak. The Inland Empire has softened more, with vacancy approaching 8% in some areas.
However, context matters enormously. Current rents, despite the correction, remain roughly 50% above pre-COVID levels. Net absorption turned positive in Q4 2025 for the first time since 2022. New construction starts have plummeted to a 10-year low in the Inland Empire. The supply pipeline that drove vacancy higher in 2023–2025 is now being absorbed, and the regulatory environment in California makes replacement increasingly difficult and expensive.
CBRE’s forecasts suggest rent growth will resume by late 2026 once the current equilibrium stabilizes. Industrial landlords with modern, functional, infill assets - precisely what Rexford owns - are positioned to benefit first as the cycle turns.
What Makes the Portfolio Irreplaceable
The key to Rexford’s asset quality is irreplaceability. These are not greenfield logistics boxes in the exurbs. Many of Rexford’s properties sit on land that is effectively impossible to replicate - infill sites surrounded by residential, retail, and other non-industrial uses, proximate to major ports, airports, and population centers. The replacement cost for many of these assets exceeds the implied price per square foot embedded in the current stock price.

Private market transactions for comparable infill SoCal industrial assets have consistently cleared at cap rates of 4.0–5.5%, even during the 2024–2025 period of elevated interest rates. Rexford itself sold properties in 2025 at cap rates in the low 4% range, achieving unlevered IRRs of 12–14%. These are the prices sophisticated buyers pay for these exact assets - and they are vastly higher than where the public market currently values the REIT.
NET ASSET VALUE ANALYSIS
Our NAV analysis segments the Rexford portfolio into five distinct asset categories, applies conservative cap rates informed by private market transaction data, and then stress-tests under progressively harsher assumptions. The goal is to identify what the market is paying for, what we are getting for free, and where the asymmetry lies.
Step 1: Establish the NOI Base
Rexford reported Total Portfolio NOI of $752.7 million for FY2025. This figure includes NOI from newly stabilized repositioning projects but also reflects the drag from properties currently offline for repositioning or development (total portfolio occupancy was only 90.2% vs. 96.0% for stabilized assets). For a conservative base case, we use the reported $752.7 million without adding back any future NOI from currently-vacant repositioning assets.
However, we need to make one adjustment. Rexford’s 2025 NOI includes NOI from properties it plans to sell in 2026 ($400–500 million in planned dispositions). Assuming $450 million of dispositions at a ~4.5% cap rate, that removes approximately $20 million of NOI. This gives us a pro-forma stabilized NOI of approximately $733 million for the ongoing portfolio.
Separately, we can identify the following NOI components from the company’s disclosures and supplemental data:
Estimated Portfolio NOI Segmentation (FY2025 Basis)
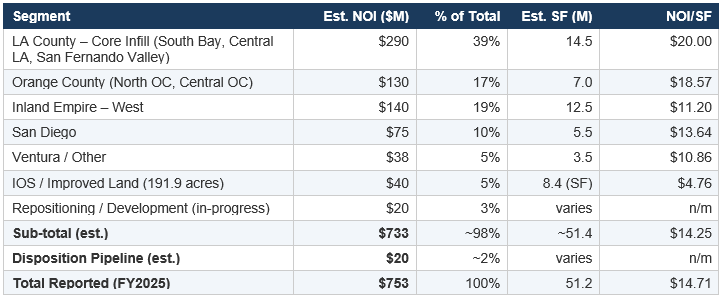
Note: Segmentation is estimated based on company disclosures, submarket data, and portfolio composition. Rexford does not publish asset-level NOI breakdowns, so these are derived from aggregate data, average rents by submarket, and known lease economics. Totals may not sum precisely due to rounding and G&A allocations.
Step 2: Apply Cap Rates (Base Case)
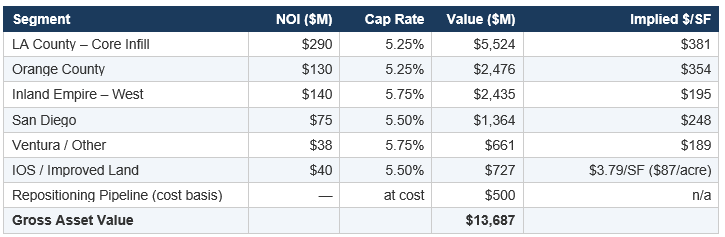
We apply cap rates informed by actual private market transaction data for SoCal infill industrial, with a deliberate conservatism bias. Rexford’s own 2025 dispositions cleared at low-4% cap rates. The Blackstone portfolio acquisition in 2024 (48 properties, $1 billion, 98% LA/OC infill) priced at roughly $332/SF. Independent brokerage data (CBRE, Cushman, Kidder Mathews) shows LA infill industrial trading at 5.0–5.3% cap rates in Q4 2025, with the Inland Empire wider at 5.5–6.0%.
Our base case cap rates are intentionally 50–100 basis points wider than recent transaction evidence to provide a margin of safety:
Base Case NAV: Cap Rate Application
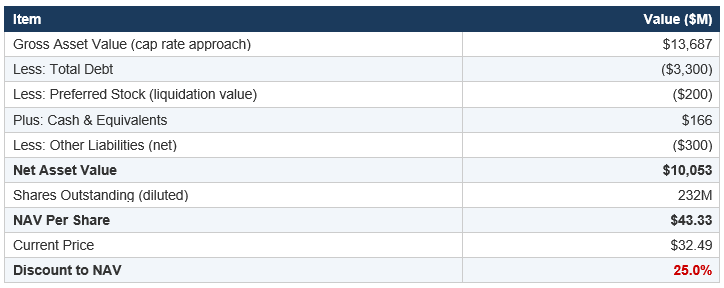
NAV Walk: Base Case
Step 3: Stress Test - What Does It Take to Justify the Current Price?
The question every investor should ask: what cap rate does the market currently imply for these assets? At an enterprise value of ~$10.8 billion and FY2025 portfolio NOI of $753 million, the implied cap rate is approximately 7.0%. For context, this is a cap rate that would be aggressive for a secondary-market office building, not for irreplaceable infill industrial in the strongest U.S. market.
To rigorously stress-test, we apply cap rates that have essentially never been observed in private market transactions for comparable SoCal infill industrial:
Stress Test: NAV Sensitivity to Cap Rates
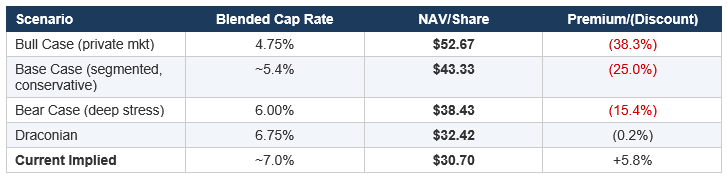
Key takeaway: Even under a 6.0% blended cap rate - a level that assumes sustained distress conditions across all of Southern California industrial - the stock still trades at a meaningful 15% discount to NAV ($38.43 vs. $32.49). You have to push cap rates to approximately 6.75% - a level with essentially no precedent in private market transactions for infill SoCal industrial - just to get to breakeven with the current stock price. The current implied ~7.0% cap rate assumes permanent impairment of asset values to a degree that contradicts all available private market evidence. This is the analytical crux of the thesis: the public market is pricing REXR as if its assets are worth 25–40% less than what private buyers are actually paying for identical properties in the same submarkets.
KEY ASSETS & ASSET-LEVEL VALUE IDENTIFICATION
While Rexford’s 419-property portfolio makes individual asset analysis challenging, several categories of assets and specific properties warrant independent attention because the market appears to assign them zero or near-zero incremental value.
1. Industrial Outdoor Storage (IOS) - The Hidden Portfolio
Rexford controls approximately 191.9 acres (8.4 million square feet) of industrial outdoor storage sites across Southern California, leased at 97.8% occupancy. IOS has emerged as one of the most sought-after industrial sub-asset classes, commanding premium valuations due to extreme supply constraints (you cannot create new IOS in infill markets - the land simply does not exist) and critical demand from logistics operators, construction materials, and equipment storage.

IOS portfolios have traded at cap rates of 4.0–5.0% in recent years. At an estimated $40 million in annualized NOI and a 5.0% cap rate, the IOS portfolio alone is worth approximately $800 million, or roughly $3.45 per share. At a private-market 4.5% cap rate, the value rises to $889 million ($3.83/share). This single asset category - which the market appears to value at approximately zero in the current stock price - represents 8–10% of the total equity capitalization.
2. The Repositioning & Development Pipeline
Rexford’s value-add strategy is a key differentiator. The company acquires functional but sub-optimized industrial properties, takes them offline, repositions or redevelops them, and re-leases at materially higher rents. In FY2025, the company stabilized seven repositioning projects totaling 748,573 square feet at a 5.0% unlevered yield on total investment - and signed an additional 2.1 million square feet of repositioning leases generating $39.5 million of incremental annualized NOI.
The current pipeline represents significant embedded value. Properties currently offline for repositioning are carried on the balance sheet at cost (~$500 million estimated remaining investment) but, once stabilized, will generate NOI at yields of 5.0–6.0% on invested capital. At a 5.25% cap rate on stabilized value, these assets could be worth $700–900 million upon completion - a $200–400 million value creation above cost that is not reflected in the current stock price.
Note: The company impaired $89.1 million of near-term development sites in Q4 2025, reflecting a decision to sell rather than build seven development sites due to elevated construction costs and new California regulatory standards. While bears cite this as evidence of strategy reversal, it actually demonstrates capital discipline - management concluded that selling the land at current valuations exceeded the risk-adjusted return of speculative development. The impairment was a write-down to estimated sale value, not a loss of the company’s repositioning capabilities.
3. 10545 Production Avenue, Inland Empire – West (Tireco)

Rexford’s single largest tenant, Tireco, Inc., occupies 1.1 million square feet at this address. Subsequent to year-end 2025, the company executed a three-year lease extension through April 2030. This single asset, assuming $8–10/SF in net rent with 3.5% annual escalators, generates approximately $9–11 million in annualized NOI. At a 5.5% cap rate, this property alone is worth $160–200 million.
4. The Blackstone Portfolio (48 Properties, LA/OC Infill)

In 2024, Rexford acquired 48 properties from Blackstone totaling 3.0 million square feet for $1.0 billion ($332/SF), with 98% leased and 99% in core LA/OC infill. This portfolio - now fully integrated - is producing NOI at yields consistent with the company’s underwriting. At acquisition cap rates in the low-to-mid 4% range with embedded rent escalators and mark-to-market upside, this portfolio has likely already appreciated 10–15% above acquisition cost. Estimated current value: $1.1–1.15 billion.
5. South Bay / El Segundo / Hawthorne Cluster
Rexford holds a significant concentration of assets in the LA South Bay submarket - one of the tightest industrial markets in the country, with vacancy below 4% and asking rents among the highest in the nation. Tenants in this submarket include aerospace (SpaceX, Northrop Grumman), defense, satellite, and advanced manufacturing companies that are willing to pay premium rents for proximity to LAX and the aerospace corridor. These assets command cap rates in the 4.25–4.75% range in the private market. Even a modest estimate suggests Rexford’s South Bay holdings are worth $1.5–2.0 billion at private market valuations.
6. Mark-to-Market Rent Upside
Perhaps the most systematically undervalued aspect of the portfolio is the embedded rent upside. Despite market rents correcting 22% from peaks, Rexford continues to execute leases at 23.4% above expiring rents on a net effective basis and 10.7% on a cash basis. This is because many in-place leases were signed 5–10 years ago at rents that are still well below today’s (corrected) market levels.
With 29.1% of the portfolio’s leases expiring through 2027, there is a significant runway of embedded NOI growth baked into the existing lease book that requires no new acquisitions, no development risk, and no market rent recovery to materialize. At 10% average cash spreads on the 29% rolling over, this represents approximately $20–25 million of incremental annual NOI over the next two years - worth $360–475 million at a 5.25% cap rate, or $1.55–2.05 per share of additional value.
WHAT THE MARKET IS GETTING FOR FREE
If we accept that the stabilized portfolio’s current run-rate NOI can be valued at a 6.0% cap rate (well above private market evidence), we can back into approximately what the market is implicitly valuing at zero:
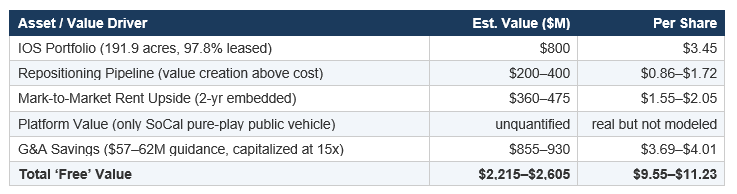
Note on G&A: Rexford is guiding to $57–62 million in G&A savings for 2026, driven by a reduction in force and organizational restructuring associated with the CEO transition. If these savings are durable and we capitalize them at 15x (consistent with REIT platform valuation multiples), this alone adds $3.69–4.01 per share to NAV. Even at a more conservative 10x multiple, it adds $2.46–2.67 per share.
MANAGEMENT ASSESSMENT & INCENTIVE ALIGNMENT
Leadership Transition
Rexford is undergoing a significant leadership transition. Co-founders and Co-CEOs Michael Frankel and Howard Schwimmer retired effective March 31, 2026, after building the company from 5.5 million square feet at IPO (2013) to 51 million square feet with nearly $1 billion in annual revenue. Laura Clark, previously COO, assumed the CEO role on April 1, 2026. John Nahas was promoted to COO.
The transition involved substantial costs - $60.2 million in non-cash equity compensation acceleration and $7 million in advisory fees - which drove the Q4 2025 GAAP net loss. While these are real economic costs, they are non-recurring and do not impair the portfolio’s earning power.
Laura Clark: The Right Operator for This Phase
Clark’s background is in real estate capital markets and investment management. She joined Rexford as CFO, was subsequently promoted to COO, and has been deeply involved in the company’s capital allocation, balance sheet management, and operational efficiency initiatives. Her stated priorities - capital discipline, operational efficiency, and shareholder returns - are precisely aligned with what the company needs in a slower-growth environment.
Critically, Clark purchased 5,310 shares of REXR stock in the open market on February 27, 2026, at approximately $37.73 per share, investing $200,338 of personal capital. Director David Stockert simultaneously bought 5,000 shares at a similar price. CFO Michael Fitzmaurice also purchased 2,650 shares. Insider buying at these levels, across three executives, is a meaningful signal of confidence in the intrinsic value of the business.
Compensation Structure & Alignment
The 2026 compensation program tilts 60% toward performance-vesting LTIP units and 40% toward time-vesting units - an improvement from the prior 55/45 split. Clark’s total equity incentive package has a grant-date value of approximately $6.2 million (base salary of $850,000 plus target cash bonus). Performance units vest based on total shareholder return relative to peers, aligning management with equity holders.
The share repurchase program is perhaps the strongest alignment signal. Rexford repurchased 6.33 million shares for $250 million in FY2025 at an average price of ~$39.50, and authorized a new $500 million buyback program. With the stock now trading below $33, continued repurchases at these levels would be enormously accretive to per-share NAV.
Management Grade: B+
Frankel and Schwimmer built an exceptional franchise. Clark inherits a portfolio of irreplaceable assets, a strong balance sheet, and a clear operational playbook. The transition creates near-term uncertainty but also presents an opportunity for a new CEO to implement a refreshed capital allocation framework - potentially including more aggressive buybacks, a leaner cost structure, and strategic pruning of non-core assets. The insider buying pattern is constructive. The key risk is execution during the transition window.
CATALYST FRAMEWORK: WHY NOW?
1. Fundamental Re-Rating Trigger: Interest Rate Normalization
REITs in general, and industrial REITs specifically, have been de-rated alongside rising interest rates since 2022. If the Federal Reserve begins cutting rates - or if the market merely begins to price in cuts - the entire REIT sector re-rates. Rexford, with 100% fixed-rate debt and no maturities until 2027, would be a prime beneficiary because it faces zero refinancing risk in a rate-cut scenario, unlike many smaller or private competitors who are wrestling with floating-rate exposure.
2. Private Market Catalyst: Take-Private or Portfolio Sale
At the current implied cap rate of ~7%, Rexford’s assets are priced at a 25–40% discount to where identical assets trade in the private market. This creates a clear arbitrage opportunity for private equity buyers, sovereign wealth funds, or strategic acquirers. Blackstone, which already sold $1 billion of SoCal industrial assets to Rexford in 2024 at 4% cap rates, would find the current pricing extraordinarily attractive from the other side of the table. A take-private at a 15–20% premium to the current price would still represent a bargain for the acquirer.
3. Capital Recycling & Buyback Accretion
Rexford is guiding to $400–500 million of dispositions in 2026 at estimated cap rates of 4–5%. If the company uses a significant portion of these proceeds to repurchase shares at the current implied 7% cap rate, it is creating enormous per-share value. Selling assets at 4.5% and buying back stock at an implied 7% is a ~250 basis point spread - the mathematical equivalent of acquiring new assets at well above market yields.
4. Repositioning Pipeline Stabilization
As repositioning projects come online through 2026–2027, they add NOI at yields of 5.0–6.0% on invested capital. The $39.5 million of incremental annualized NOI signed in 2025 has not yet fully flowed through the income statement. As these projects stabilize and lease up, the NOI growth profile inflects - exactly the kind of visible acceleration that drives multiple expansion.
5. SoCal Market Cycle Turn
Multiple brokerage forecasts project rent growth resuming in SoCal industrial by late 2026 as the current supply pipeline is absorbed and new construction remains constrained. If market rents stabilize and begin to inflect upward, the narrative around REXR shifts from “cyclical headwind” to “structural beneficiary.” The stock historically trades at 30–40x FFO in periods of positive rent growth expectations; it currently trades at roughly 14x.
RISK ASSESSMENT: WHAT COULD GO WRONG
1. Prolonged SoCal Industrial Weakness
If market rents decline another 10–15% from current levels (which would represent a total correction of 30–40% from peak - historically unprecedented for SoCal industrial), the embedded lease spread advantage narrows and NOI growth stalls further. Same-property NOI is already guided to decline 1.5–2.5% in 2026. Additional softness could extend this into 2027.
Impact: Moderate. The portfolio’s existing lease base provides substantial insulation, with average in-place rents still below market.
2. Tariff & Trade Policy Disruption
Southern California’s industrial market is significantly exposed to Pacific Rim trade flows through the ports of Los Angeles and Long Beach. Escalating tariffs, nearshoring trends, or a sustained decline in import volumes could weaken demand for port-proximate logistics space.
Impact: Moderate. Rexford’s portfolio is predominantly driven by regional consumption and last-mile delivery rather than pure port logistics. The company’s small-bay focus serves a diverse tenant base less concentrated in import/export.
3. CEO Transition Execution Risk
Leadership transitions always carry execution risk. Clark’s track record is strong but untested in the CEO seat. Any missteps in capital allocation, operational execution, or market messaging could create additional downside in a stock that already trades near its 52-week low.
Impact: Moderate. Mitigated by insider buying and a strong existing team.
4. Interest Rate Risk
If rates remain elevated or move higher, REIT valuations could compress further. While Rexford’s balance sheet is well-positioned (100% fixed, 3.3-year weighted average maturity), the stock remains correlated to the broader REIT complex.
Impact: Moderate. Rexford’s debt matures in 2027+; refinancing at higher rates would increase interest expense by $15–25M annually on $3.3B of debt, reducing FFO by $0.06–0.11/share. Material but manageable.
5. Dilution from Capital Needs
If Rexford needs to issue equity to fund repositioning or cover debt maturities, doing so at current depressed prices would be significantly dilutive.
Impact: Low. The company has $1.4B in total liquidity, $400–500M in planned dispositions, and no debt maturities until 2027. The probability of forced equity issuance in the near term is very low.
6. Earthquake / Natural Disaster
Southern California is seismically active. A major earthquake affecting the portfolio could result in property damage, tenant displacement, and insurance claims.
Impact: Tail risk. Industrial buildings are generally more resilient to seismic events than other property types, and Rexford carries comprehensive insurance. But it is a real, if low-probability, risk for any SoCal-concentrated portfolio.
ASYMMETRIC UPSIDE: WHAT THE MARKET IS MISSING
1. The NAV Gap Is Too Wide for a Portfolio of This Quality
The single most important point: there is no precedent for infill SoCal industrial trading at a 7% implied cap rate in the private market. The public market is pricing these assets at a 25–40% discount to where they actually change hands between sophisticated, well-informed private market participants. This is not a matter of opinion - it is observable in Rexford’s own disposition pricing (low 4% cap rates) and in recent institutional transactions across the market.
The efficient market response to this would be either: (a) the public market re-rates to close the gap, or (b) a private buyer takes the company out. Both are favorable outcomes for equity holders.
2. The Buyback at These Levels Is Extraordinarily Accretive
If Rexford deploys $500 million in buybacks at $33/share (the current price), it retires approximately 15 million shares, or roughly 6.5% of shares outstanding. Combined with the 6.33 million shares already retired in 2025, cumulative buybacks would have reduced the share count by over 10% since the program began. At a 5.25% cap rate NAV of ~$43/share, buying back stock at $33 creates $1.50+ of per-share NAV accretion per $500 million deployed. This is the highest-returning use of capital available to the company.
3. IOS Scarcity Is Only Increasing
Industrial outdoor storage land in infill Southern California cannot be created. Environmental regulations, zoning restrictions, and competing land uses ensure that the existing supply of IOS sites is the maximum supply that will ever exist. As e-commerce, construction, and infrastructure spending grow, demand for IOS only increases. Rexford’s 191.9-acre IOS portfolio is a wasting scarcity asset that compounds in value with every year that passes without new supply.
4. The G&A Restructuring Creates a Step-Change in Margins
The $57–62 million in guided G&A savings for 2026 represents a permanent reduction in the company’s cost structure. On a $750 million NOI base, this effectively adds 7–8% to the company’s operating margin. Capitalized at any reasonable multiple, this is worth $500–900 million to equity holders - and it flows entirely to the bottom line.
5. Embedded Rent Escalators Are a Hidden Compounding Engine
Rexford’s recent leases include 3.5% annual contractual rent escalators. On a $750 million NOI base, even without any mark-to-market upside, these embedded escalators generate approximately $26 million in additional NOI annually - a 3.5% organic growth rate that requires zero capital investment and is contractually locked in. Over a 3-year hold, this alone adds approximately $80 million to annualized NOI, worth $1.5 billion at a 5.25% cap rate. The market is pricing the stock as if this growth does not exist.
VALUATION FRAMEWORK: PUTTING IT TOGETHER
Price Target Scenarios
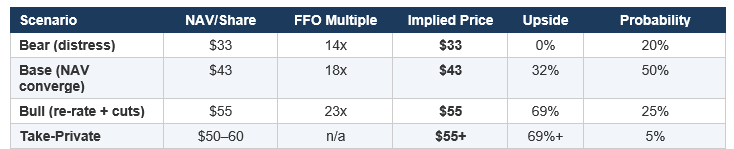
Probability-weighted expected value: ~$44.60/share, representing approximately 37% upside from the current price, plus a 4.5–5.3% dividend yield while you wait. Total expected return: ~42% over a 12–18 month horizon.
The Margin of Safety
The downside is well-defined. At the current price of ~$33, you are buying the portfolio at an implied 7% cap rate. Even if the Southern California industrial market experiences a deeper and more prolonged correction than any in its modern history, the physical scarcity of these infill sites provides a floor. Land in infill LA does not become worthless. Buildings in the South Bay do not trade at Inland Empire secondary-market cap rates. The structural advantages are permanent.
Meanwhile, the upside is substantial and multi-dimensional: NAV convergence, interest rate tailwinds, buyback accretion, repositioning value creation, market rent recovery, and potential M&A. The risk/reward is asymmetric.
CONCLUSION
Rexford Industrial is a high-quality, irreplaceable portfolio of Southern California infill industrial assets trading at a deep discount to private market values. The market is treating cyclical headwinds (rent corrections, occupancy normalization, leadership transition) as permanent impairments to a structural scarcity asset.
The base case NAV of ~$43 per share implies 25–30% upside from current levels, supported by conservative cap rates that are 50–100 basis points above actual transaction evidence. The downside is bounded by the physical scarcity and replacement cost of the assets. The upside is amplified by accretive buybacks, embedded rent escalators, repositioning value creation, and the possibility of a private market transaction.
The central question is not whether these assets are worth more than the current stock price - the private market has answered that question definitively. The question is how long the public market can sustain a 25–40% discount to reality. History suggests: not forever.