
FRP Holdings (FRPH) | Part 2 : NAV Deep Dive
40%+ NAV Discount | Evidence-Based Asset-by-Asset Valuation

1. Mining Royalty Lands: The Crown Jewel
The Mining Royalty Lands segment is the single most valuable and most defensible asset within FRP Holdings. It is also the asset the market most profoundly misprices. Below we build the valuation from first principles: revenue mechanics, comparable transactions, and replacement cost analysis.
1.1 Asset Description & Revenue Mechanics
FRP owns fee simple interests in 14 open-pit aggregate quarries across approximately 16,648 acres in Florida, Georgia, and Virginia, plus an additional 4,280 acres through a Brooksville, FL joint venture with Vulcan Materials. Nine quarries are actively mined; five are leased but not yet mined. Independent reserve estimates exceed 500 million tons. The company’s lessees include Vulcan Materials (NYSE: VMC), Martin Marietta (NYSE: MLM), Cemex, Argos, and The Concrete Company - a blue-chip tenant roster.
The royalty structure is elegant in its simplicity: tenants pay FRP approximately 10% of the average annual sales price per ton of aggregate sold from each property. Minimum annual rental payments apply even when mining activity is low or paused. FRP bears zero operating costs: all mining, permitting, environmental compliance, reclamation liability, and capital expenditure is borne by the tenant/operator. This is a pure landowner royalty - functionally identical to a mineral royalty interest in oil and gas, but with a far longer reserve life and no depletion risk in the foreseeable future.
Revenue Build-Up
Using Vulcan’s disclosed 2025 freight-adjusted aggregate selling price of $21.98/ton and FRP’s historical mining volumes of approximately 7.5–9.5 million tons/year, we can back into the implied royalty economics:
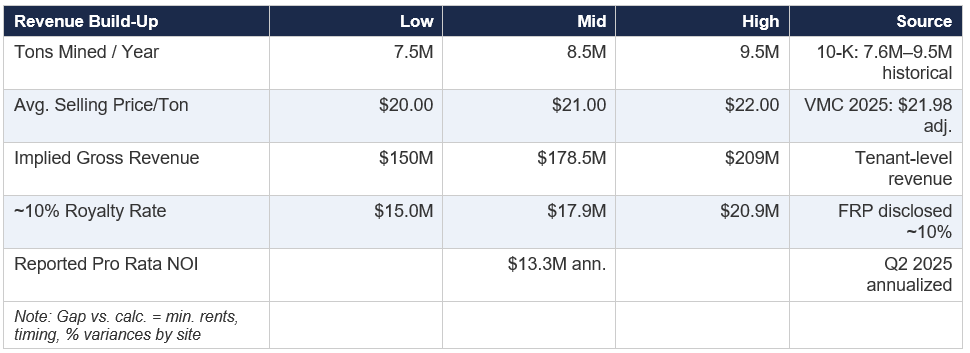
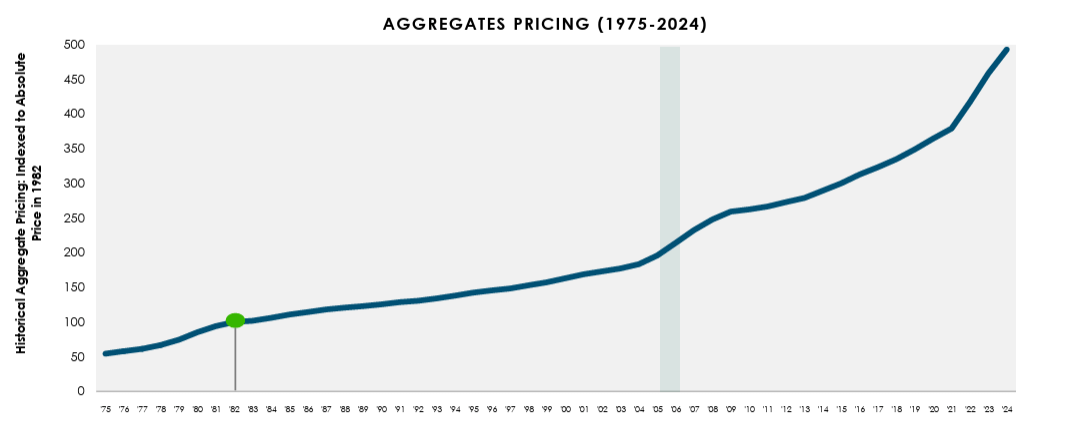
The reported $13.3M annualized NOI likely underestimates stabilized run-rate because (a) four quarries are leased but not yet mined, contributing only minimum rents; (b) aggregate pricing has compounded at high single digits (VMC pricing +4.2% in 2025, +7% in Q1 2025); and (c) volumes are cyclically depressed relative to pre-pandemic peaks. At Vulcan’s current $22/ton pricing trend, a normalized volume of 8.5M tons would generate roughly $18M+ of royalty income - 35% above current reported levels.
1.2 Comparable Transactions
There is a robust set of M&A transactions in the aggregate sector that provides direct benchmarks for valuing FRP’s mining lands:
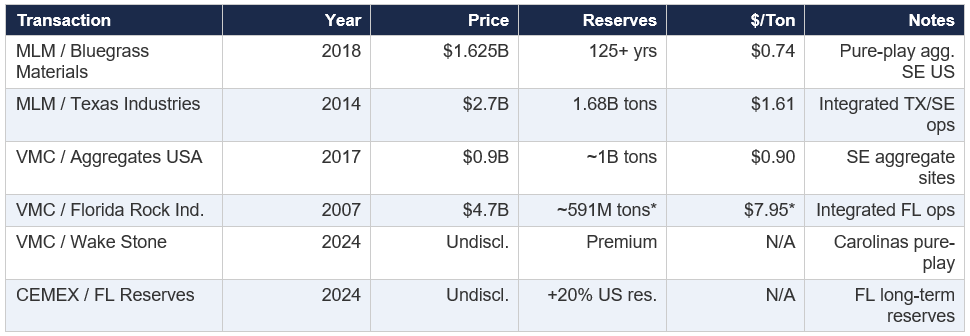
*Florida Rock Industries was an integrated operator with quarrying, asphalt, concrete, and cement operations; the $/ton figure includes operating business value, not just reserves. Bluegrass/Texas Industries figures are more directly comparable to FRP’s pure royalty model.
Key observations from the transaction evidence:
• Bluegrass Materials ($0.74/ton): This is the most directly comparable transaction. Bluegrass was a pure-play aggregates company with 23 sites across Georgia, South Carolina, Maryland, Kentucky, and Tennessee - overlapping significantly with FRP’s geographic footprint. The Baker family held a 15% stake in Bluegrass and was active in its management.
• Texas Industries ($1.61/ton): Higher per-ton value reflects Texas’s rapidly growing construction market and the integrated nature of the business (cement, aggregates, ready-mix).
• FRP’s implied valuation at current market cap: At ~$398M market cap, if we assign $150M to all non-mining assets (roughly their book value), the remaining ~$248M attributed to mining implies roughly $0.50/ton. This is well below every single comparable transaction.
Reserve Scarcity Premium
FRP’s reserves deserve a scarcity premium over the transaction set for several reasons. First, Florida is the most permitting-constrained aggregate market in the United States - the Lake Belt mining litigation, Everglades-related environmental restrictions, and land-use opposition have made it virtually impossible to permit new quarries in the state’s high-growth corridors. Second, FRP’s reserve life of 60–100+ years (management has confirmed reserves have not declined despite ongoing depletion, implying deeper deposits are being discovered) provides a near-perpetual duration that most transaction comparables do not possess. Third, FRP’s pure royalty structure - zero capex, zero opex, zero environmental liability - commands a premium over integrated operator businesses because the cash flow stream has no operational risk embedded in it.
1.3 NAV Methodology: Three Approaches
Approach A: Capitalized NOI
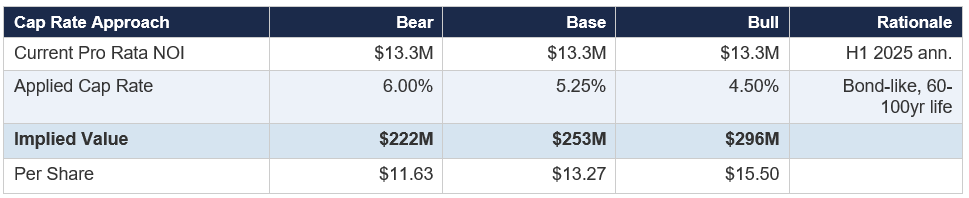
Cap rate rationale: A 5.25% midpoint cap rate reflects the bond-like quality (zero opex/capex), inflation protection (royalties rise with aggregate pricing), and 60–100 year duration. This is tighter than typical real estate but wider than pure mineral royalty companies (e.g., Texas Pacific Land trades at 2–3% implied cap). A 4.50% bull cap rate reflects Vulcan’s own 2025 freight-adjusted pricing growth of 4.2% and 20%+ gross profit/ton growth, which flows directly through to FRP’s royalty base.
Approach B: Per-Ton Reserve Valuation
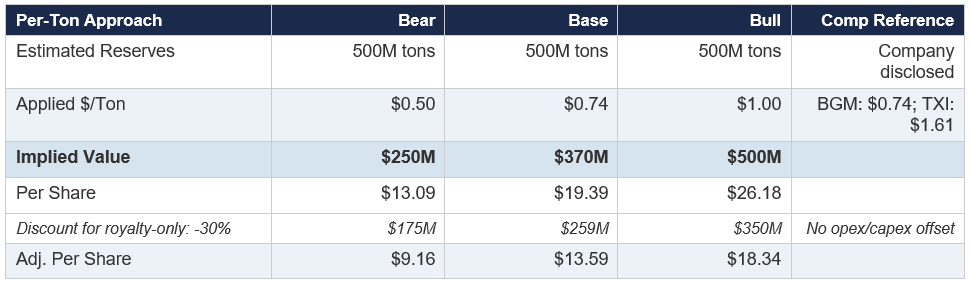
The per-ton approach generates a much wider range because the transaction comps valued integrated operations (quarrying + downstream). We apply a 30% discount for the royalty-only structure in our conservative case, but note that a counter-argument exists: pure royalties should command a premium, not a discount, because they carry zero operational risk. The Bluegrass comp at $0.74/ton already reflects a pure-play aggregates company with operating costs; a royalty on the same reserves should theoretically be worth less in absolute dollars but more on a risk-adjusted basis.
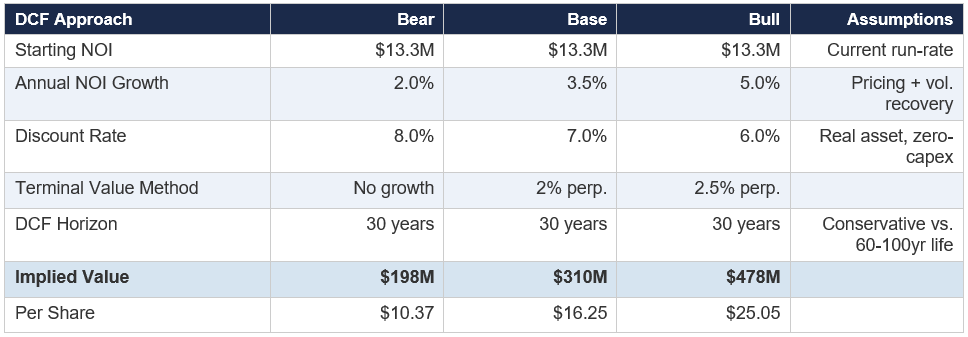
Approach C: Discounted Cash Flow
Triangulated Mining Value
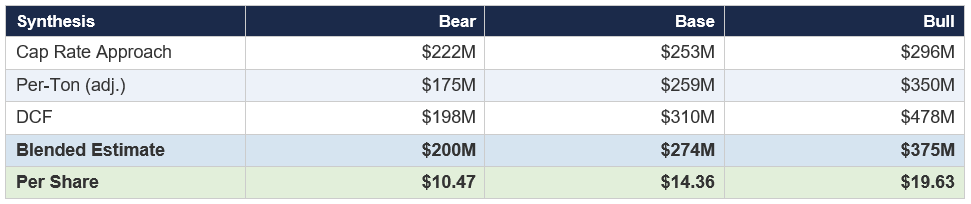
Our blended midpoint of $274M assigns $0.55/ton to FRP’s reserves - still well below the Bluegrass precedent at $0.74/ton, let alone higher-value transactions. We believe this is conservative, particularly given Vulcan’s 2025 aggregate selling prices of $21.98/ton (up 4.2% YoY), cash gross profit/ton of $8.66 (up 4.8%), and the company’s own guidance for continued pricing improvement in 2026 targeting $2.4–$2.6 billion of adjusted EBITDA. Every dollar of Vulcan pricing improvement flows proportionally through FRP’s ~10% royalty.
2. Multifamily Portfolio: DC Waterfront Core
2.1 Property-Level Detail
FRP’s multifamily portfolio is concentrated in Washington, DC’s Capitol Riverfront and Buzzard Point submarkets, with one property in Greenville, SC. All properties are held through JVs with MRP Realty, an experienced DC-area developer. Below we present property-level operating metrics and valuations.
Cap Rate Context: DC Class A Multifamily
Per CBRE’s H2 2024 and Q1 2025 surveys, Class A multifamily cap rates in Washington DC average 4.74%, with B-class assets at 4.92%. CoStar reports effective rents inside the Beltway hit an all-time high of $2,173/month in 2024. Transaction volume inside the Beltway recovered 40% in deal count and 98% in dollar volume in 2024 (JPMorgan Chase/CoStar data). Importantly, the supply pipeline is declining sharply: only 6,089 units expected in 2025 and 3,955 in 2026, down from 14,700 delivered in 2024 - which should significantly improve landlord pricing power.
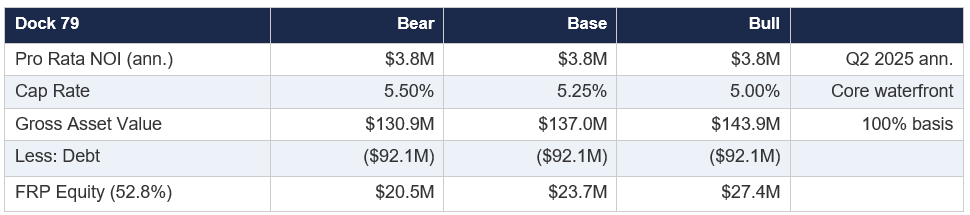
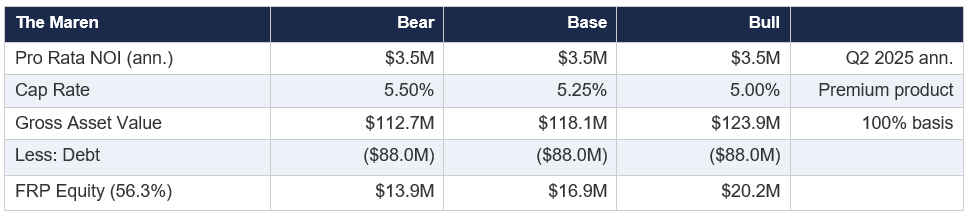
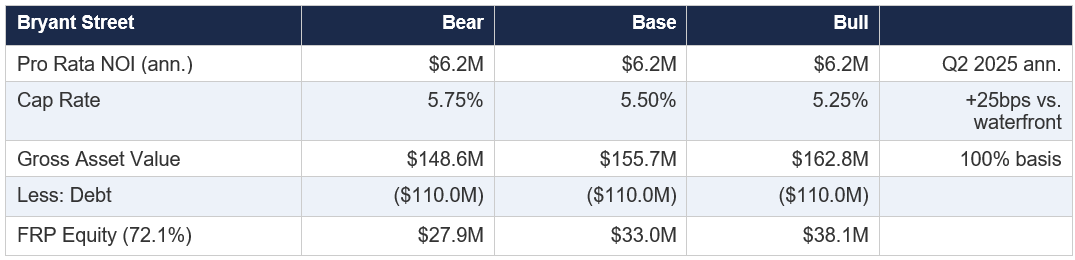
Management uses cap rate ranges of 5.00%–5.75% across the multifamily portfolio, which we regard as conservative for stabilized Class A waterfront product in DC’s strongest submarket. Our independent cap rates range from 4.75%–5.75%, with tighter rates applied to the core Dock 79/Maren assets (which have direct Anacostia waterfront exposure adjacent to Nationals Park) and wider rates for newer or further-afield properties.
Dock 79 (FRP 52.8%)
Dock 79 is the first phase of FRP’s Riverfront on the Anacostia development. A 305-unit, 9-story residential building completed in 2016 at 79 Potomac Avenue SE. Retail tenants include The Salt Line, All-Purpose Pizzeria, and Dacha Beer Garden - three of the most popular restaurants in the Capitol Riverfront submarket. Directly on the Anacostia waterfront, adjacent to Nationals Park, with unobstructed water and monument views.
The Maren (FRP 56.3%)
Phase 2 of the Riverfront development, a 264-unit luxury building completed in 2020 with 12,500 sq ft of retail. Premium finishes (Brizo fixtures, gas ranges, smart locks), 360-degree views from upper floors. Managed by KETTLER, a top-tier DC property manager.
Bryant Street (FRP 72.1%)
The largest multifamily asset by FRP equity value. Phase 1 includes 487 units, 40K+ SF retail (anchor: Alamo Drafthouse Cinema), a public plaza, and improvements to the Metropolitan Branch Trail connecting directly to a Red Line Metro station. Located in the Edgewood neighborhood between Eckington and Brookland - an established growth corridor in NE DC. The full build-out is planned for 1,650 units and 250K SF of retail. FRP’s 72.1% ownership stake makes this the single largest equity position in the multifamily portfolio.
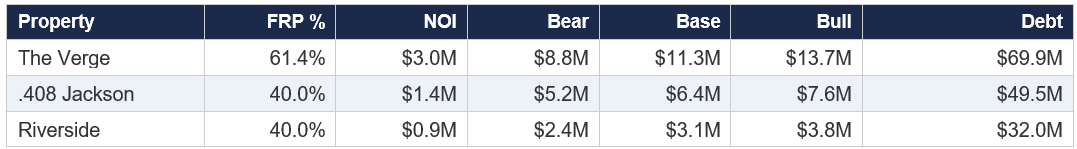
Remaining Properties
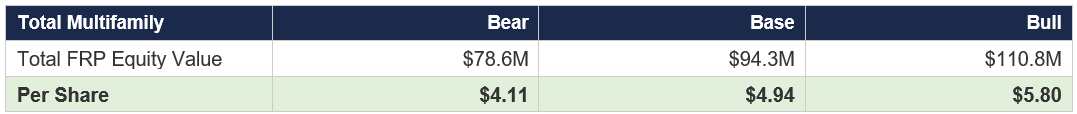
Consolidated Multifamily NAV
A key upside catalyst: the Steuart Investment Company/MRP agreement (November 2022) for up to 10 mixed-use projects comprising 3,000+ residential units and 150K SF of retail across Capitol Riverfront and Buzzard Point. SIC purchased a 20% tenancy-in-common in Dock 79 and The Maren for $65.3M ($44.5M attributable to FRP) - a transaction that provides a third-party price validation of the core waterfront assets.
3. Industrial & Commercial: Platform in Transformation
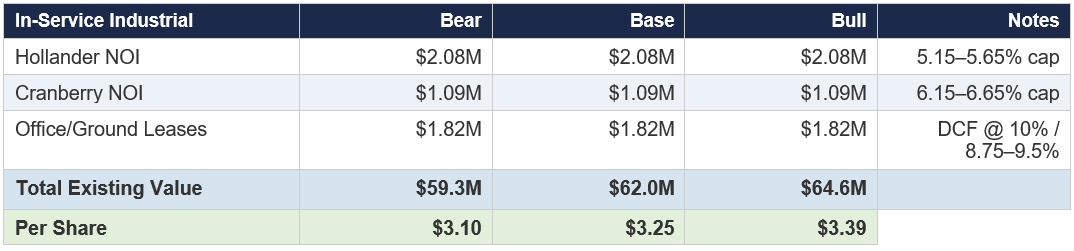
3.1 Existing Portfolio
The in-service industrial portfolio is modest: approximately 550,000 sq ft across ten warehouses in the Baltimore-Washington corridor (Hollander Business Park, Cranberry Industrial Park) plus two ground leases and one office building. Annualized pro rata NOI is $3.2M from industrial and $1.8M from office/ground leases.
However, this segment is undergoing a 5x transformation. Management has stated a target of expanding from 550K to 2.7M sq ft through the development pipeline. The Altman Logistics acquisition accelerated this plan materially.
Market Context: Baltimore/I-95 Industrial
The Baltimore/I-95 corridor is one of the strongest industrial markets on the East Coast. Key data points from Colliers, Newmark, and MacKenzie Commercial Q1–Q3 2025 market reports:
• Average rental rates: $11.06–$11.76/SF triple net across the corridor, with premium submarkets (BWI Corridor, Columbia) commanding $11.20–$13.77/SF.
• Vacancy: 7.4–9.6%, down from recent peaks, with strong positive absorption in H2 2025.
• Sales comps: Average industrial sales price of ~$193/SF in Q1 2025 per MacKenzie.
• Cap rates: Industrial cap rates compressed 5 bps in Q1 2025; Class A industrial at 4.84%, averaging 5.22–6.71% across classes.
• New supply shifting north: Due to limited available land in the BWI Corridor, new industrial development has shifted to Harford and Cecil Counties along I-95 -precisely where FRP holds its largest land positions.
3.2 Development Pipeline: Where the Value Is Created
The development pipeline is where the industrial story becomes transformational. We value each project based on expected stabilized NOI, market cap rates, and FRP’s equity position:
Near-Term Pipeline (2025-2027 Delivery)
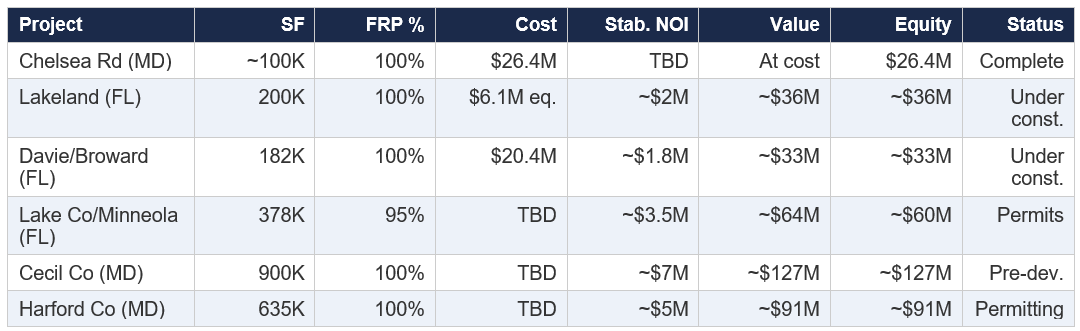
Stabilized NOI estimates assume market rents of $8–$12/SF NNN (consistent with Colliers/MacKenzie Baltimore corridor data for new Class A product) and 95% occupancy. Value estimates use 5.5% stabilized cap rate. FRP’s four priority projects (850K SF, $146M cost) are projected to generate $8.7M–$10.2M stabilized NOI, with FRP’s share at $7.9M–$9.2M - management’s own estimates.
Management’s stated target: stabilized NOI from the four priority industrial projects of $8.7M–$10.2M at the property level, with FRP’s share at $7.9M–$9.2M. At a 5.5% cap rate, $9M of FRP-share NOI implies $164M of equity value from these projects alone - against a current market cap of $398M. The Altman-acquired minority interests in three NJ/FL projects (510K SF) are expected to generate 2x MOIC on ~$8M of invested capital upon sale.
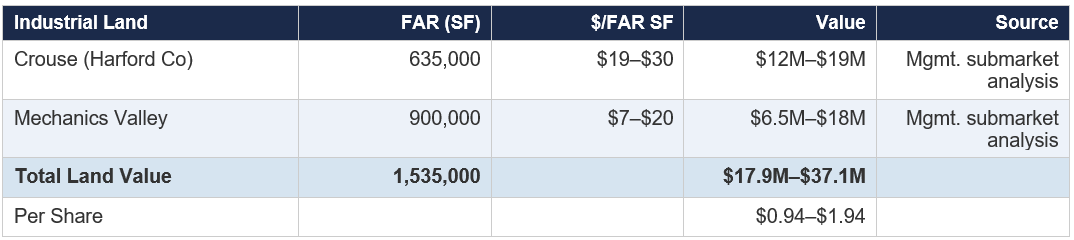
Industrial Land Bank
4. Development Pipeline & Land Bank
4.1 DC Waterfront Future Phases
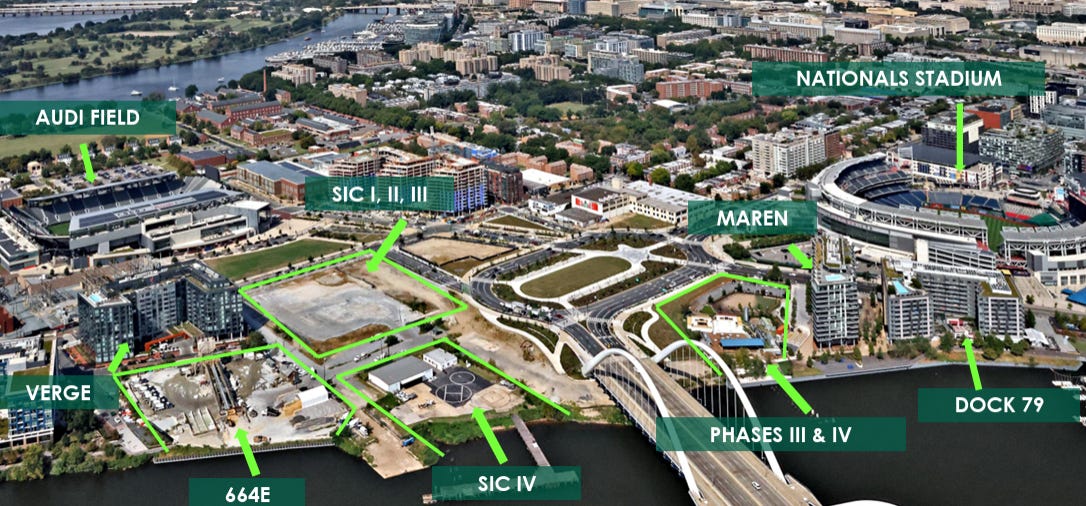
This is the most significant “hidden asset” within FRPH. Phases III, IV, and the 664E Vulcan/Buzzard Point site represent 875,000 FAR square feet of future development capacity in what has become one of DC’s most desirable mixed-use submarkets. The November 2022 agreement with Steuart Investment Company and MRP Realty envisions up to 10 mixed-use projects totaling 3,000+ residential units and 150K SF of retail.
Land Valuation Evidence
Management values future DC phases using the land-per-FAR-SF metric, benchmarked against the Maren and Verge land contributions:
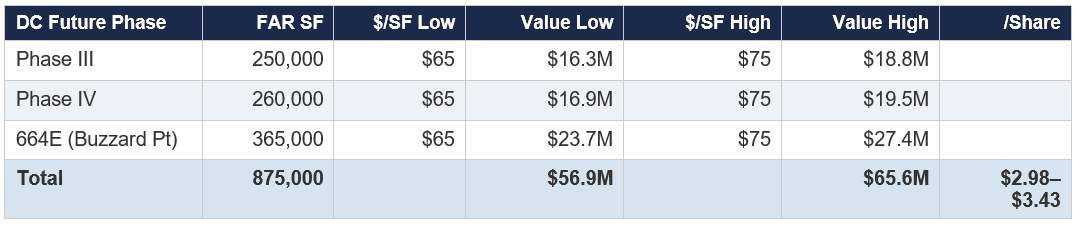
Why this is conservative: The $65–$75/FAR SF land valuation reflects raw entitled land value only. It assigns zero credit for the development margin FRP would capture by building out these sites - which, based on the Dock 79 and Maren precedents, would generate substantial additional value. If these 875K SF were developed into 3,000 residential units at an average development cost of $400K/unit and sold or stabilized at $500K+/unit, the development margin could exceed $300M. Obviously, this requires many years and significant capital, but the optionality is real and unpriced.
The Steuart Investment Company’s willingness to pay $65.3M ($44.5M to FRP) for a 20% tenancy-in-common in Dock 79 and The Maren provides a critical third-party price discovery data point. This transaction valued those two buildings at approximately $326M on a 100% basis - broadly consistent with our cap-rate-derived valuations.
4.2 Residential Land & Other Development
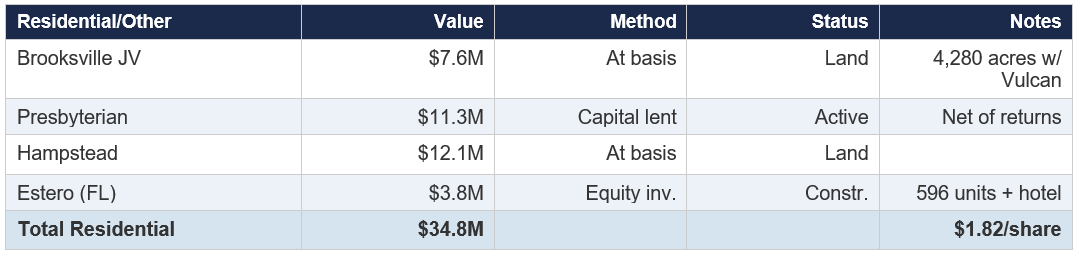
Aberdeen Overlook: A Capital Recycling Case Study
The Aberdeen Overlook lending venture deserves special attention as evidence of management’s capital allocation skill. FRP committed $31.1M to fund development of 344 residential lots in Maryland. As of Q3 2025, $27M had been drawn and $24.7M had been returned in principal and preferred interest payments. A national homebuilder is under contract for all remaining lots through Q4 2027. Management projects $11.2M in total profit, representing a 36% return on drawn funds. This is not a one-off - it illustrates FRP’s ability to generate private-equity-like returns from its development expertise without taking permanent balance sheet risk.
4.3 Altman Logistics Pipeline
The October 2025 Altman Logistics acquisition ($33.5M purchase price, $23.6M net cash) brought minority GP interests in six industrial projects totaling ~1.3M SF across Florida and New Jersey. Management expects 15–20%+ IRR at the property level on a develop-and-sell basis, and 2x MOIC on the ~$8M FRP expects to invest in the three promote-eligible NJ/FL projects. At cost, these interests are carried at $63.1M in the SOTP; upon stabilization and sale, the promote waterfall should generate meaningfully higher returns.
5. Cash & Balance Sheet
As of June 30, 2025, FRP reported $153.2M in cash on the balance sheet. Total debt was $180.4M (primarily non-recourse JV-level mortgage debt), and shareholders’ equity was $461.4M. The company recently established a five-year, $50M revolving credit facility with Wells Fargo at SOFR + 2.25%, providing additional liquidity.
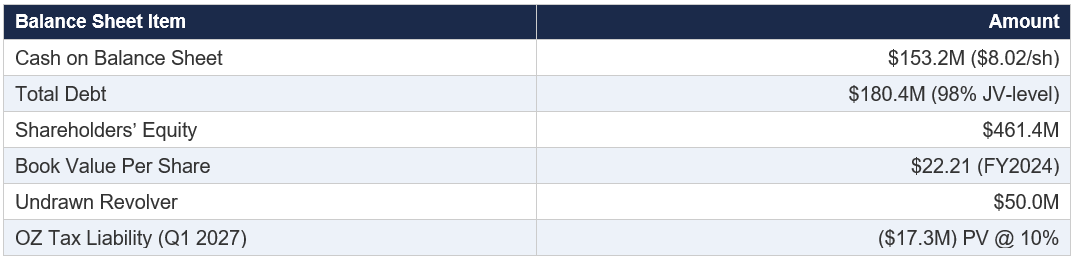
The $153M cash position is remarkable relative to the $398M market cap. It represents 38% of the entire enterprise and provides management with substantial optionality. The 2025 capital deployment plan calls for ~$71M of equity investment: $21M for Florida industrial, $35M for Estero/Greenville multifamily, and $10–$25M for new opportunistic projects. Even after full deployment, the company would retain ~$80M+ of liquidity before any cash flow from operations.
The Opportunity Zone tax liability of approximately $20.5M (due Q1 2027, discounted to $17.3M at 10%) relates to deferred gain recognition on the initial OZ investments in the DC waterfront projects. This is a known, finite liability that has been fully provisioned in the SOTP analysis.
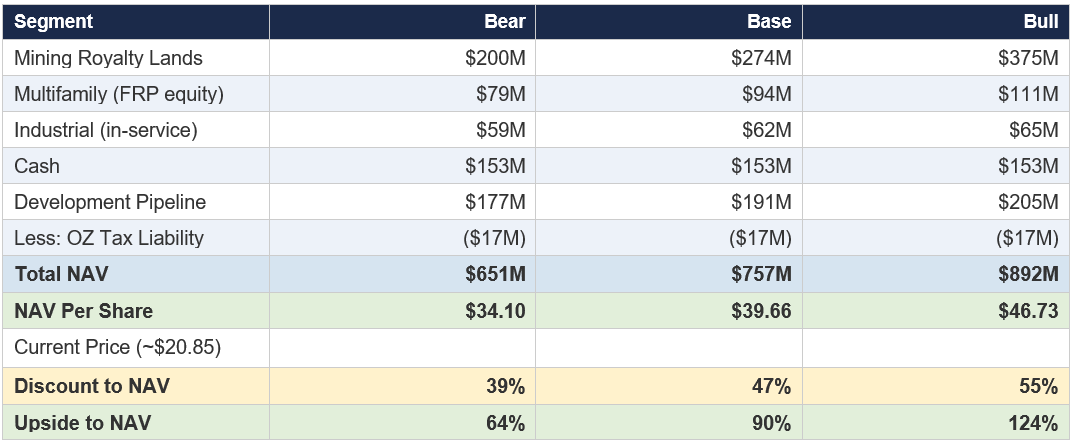
6. Consolidated NAV & Sensitivity Analysis
6.1 Bottom-Up NAV Summary
6.2 What Gets You to $1 Billion?
Management has explicitly stated a target of increasing the SOTP valuation to over $1 billion upon stabilization of the five-year development pipeline. Here is how the math works:
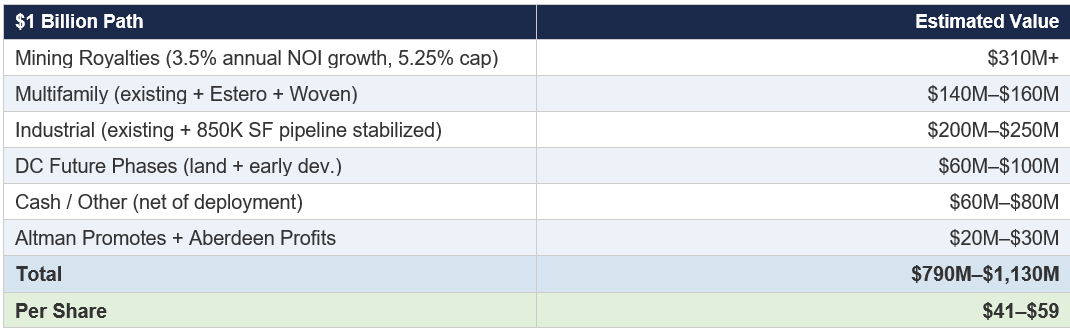
The $1 billion target is achievable under reasonable assumptions - it does not require heroic cap rate compression, above-market rent growth, or flawless execution. It simply requires the company to deliver on its stated development pipeline at market economics and for aggregate pricing to continue its multi-decade upward trajectory. The mining royalty segment alone, growing at 3.5% annually from $13.3M and capitalized at 5.25%, would be worth $310M+ within five years - nearly 80% of the current total market cap.
6.3 Sensitivity: Mining Royalty Cap Rate vs. NOI Growth
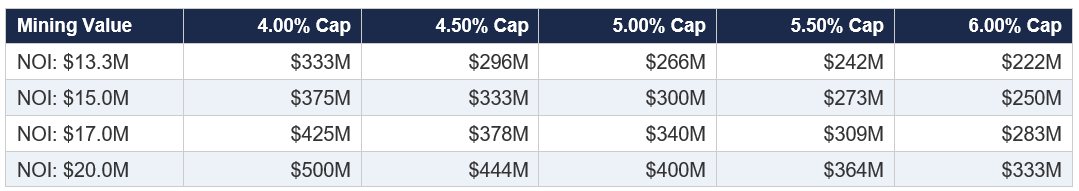
At normalized volumes and current Vulcan pricing trends, a $17M–$20M mining NOI is plausible within 3–5 years. At a 5.00% cap rate (consistent with the duration and zero-cost nature of the royalty stream), this implies $340M–$400M of mining value alone - essentially the entire current market cap. Every other asset segment becomes pure upside.
7. Summary of Evidence & Conviction Level
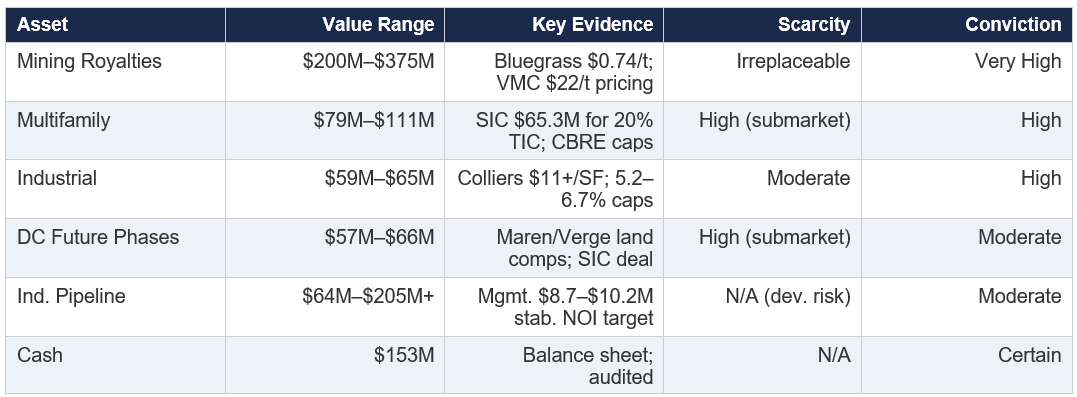
The central insight of this analysis is that the mining royalty segment alone, valued conservatively, supports 50–75% of the current market capitalization. Valued at comparable transaction benchmarks, it exceeds the market cap entirely. Every other asset - $94M of multifamily equity, $62M of industrial, $153M of cash, $191M of development pipeline - is layered on top as unpriced optionality. The 39–55% discount to NAV, with a family-aligned management team actively executing a visible growth plan, represents one of the more compelling risk/reward asymmetries in the small-cap real estate universe.
Disclaimer: This document is for informational purposes only and does not constitute investment advice. All data sourced from public filings, company presentations, SEC filings, CBRE, Colliers, Newmark, CoStar, and third-party research. Investors should conduct their own due diligence.