
Canterbury Park (CPHC) | Part 2: NAV Deep Dive
50%+ NAV Discount | GAAP Book Value Dramatically Understates JVs & Land Value

Introduction: The GAAP Distortion Problem
Canterbury Park’s balance sheet is among the most distorted in micro-cap equities. The combination of historical-cost land accounting, equity-method JV losses driven by non-cash depreciation, and a TIF receivable structure unfamiliar to most equity investors creates a situation where the GAAP financials actively obscure the company’s intrinsic value. This Part II provides a forensic, evidence-based valuation of each balance sheet component using the company’s 2025 10-K (filed March 10, 2026), comparable market transactions, and third-party data sources.
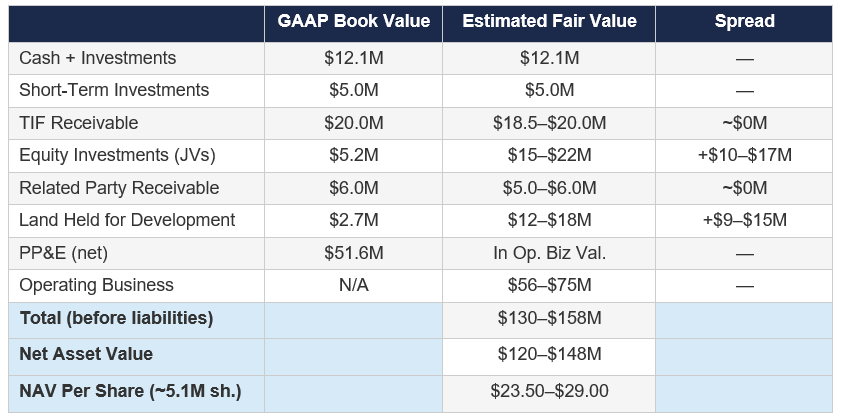
We begin with the actual 2025 balance sheet and then systematically re-mark each asset to its estimated fair market value, providing specific evidence for every adjustment. The goal is to replace the GAAP abstraction with a concrete, defensible NAV.
Audited Balance Sheet as of December 31, 2025
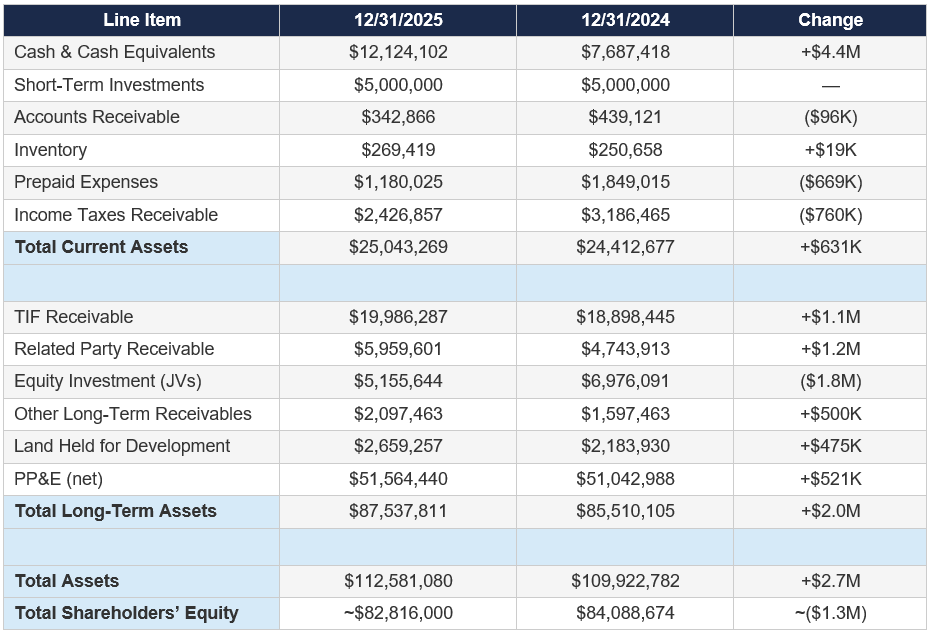
Shares outstanding: approximately 5,098,000 as of December 31, 2025. At the current price of $15.50, the market capitalization is approximately $79.0 million. Book value per share is approximately $16.24, meaning the stock trades at 0.95x book value — a discount to stated GAAP equity, which itself dramatically understates fair value.

Asset 1: Cash and Short-Term Investments ($17.1M)
The Facts
Per the 2025 10-K, the company held $12,124,102 in cash and cash equivalents and $5,000,000 in short-term investments as of December 31, 2025, for a combined $17.1 million. Cash increased $4.4 million year-over-year, driven by declining capital expenditures as the TIF infrastructure and barn redevelopment projects approached completion. The $5 million in short-term investments has been held at a constant balance for the past two years, suggesting money-market or Treasury-equivalent instruments.
Valuation Evidence
Cash at par value. No discount required. The company has zero debt — no revolving credit facility drawdowns (the $5M revolver was undrawn as of 12/31/25), no term loans, no bonds. This is a genuinely unencumbered cash pile.
Context: At the current market cap of $79 million, cash and short-term investments alone represent 21.7% of the company’s enterprise value. Said differently, for every $1.00 of CPHC equity purchased at the current price, $0.22 is backed by cash on the balance sheet. This is an exceptionally high cash-to-market-cap ratio for a profitable operating company.
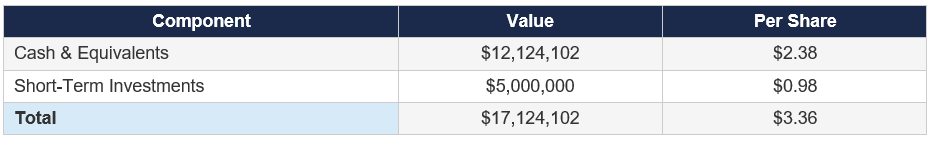
Assessment: $17.1M = $3.36/share
Dollar-for-dollar value. Zero discount. Zero debt offsets. This is the hardest floor in the entire NAV analysis.
Asset 2: Tax Increment Financing Receivable ($20.0M)
Structure and Mechanism
In 2018, the City of Shakopee approved a TIF district encompassing the Canterbury Commons development area. Under this agreement, Canterbury fronted the cost of developer improvements — roads, utilities, grading, stormwater management, and public infrastructure — required to support the master-planned community. In exchange, the City pledged to reimburse Canterbury from incremental property tax revenues generated by the new developments. The TIF receivable accrues interest and is repaid as the assessed property values within the district generate tax increment.
Balance Sheet Trajectory
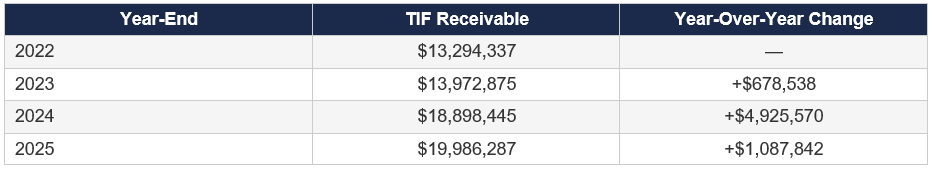
The sharp increase in 2024 reflects the acceleration of infrastructure spending as Canterbury completed the final phases of road construction, including the critical road adjacent to the amphitheater site that unlocked 25 acres of development land. The 2025 balance grew more modestly as construction wound down.
Collectibility Evidence
Canterbury received its first TIF reimbursement payment of approximately $580,000 in Q4 2025. This is the single most important data point for validating the receivable’s collectibility. The payment mechanism is now operational; property taxes from completed developments are flowing through the TIF district and generating reimbursable increment. As more properties stabilize and are assessed at full value — the Triple Crown Residences Phase II was refinanced in January 2026, indicating a formal appraisal; The Omry is 99% occupied; the Greystone office building is 66% leased — the tax base within the district will grow, accelerating reimbursement.
Per the 10-K, Canterbury expects to complete remaining developer improvements by July 17, 2027 and to be reimbursed by no later than that date. The company has never recorded a loss allowance against this asset, indicating management’s confidence in full collection.
Valuation
We value the TIF receivable at 92–100% of face value, yielding a range of $18.4–$20.0 million. The low end applies a modest 8% discount for time value (approximately 1.5 years to full collection at a 5% discount rate). The high end reflects par value, appropriate given that: (a) the counterparty is a municipal government; (b) repayments have already commenced; (c) the underlying tax base is growing as properties stabilize; and (d) no loss allowance has ever been recorded.
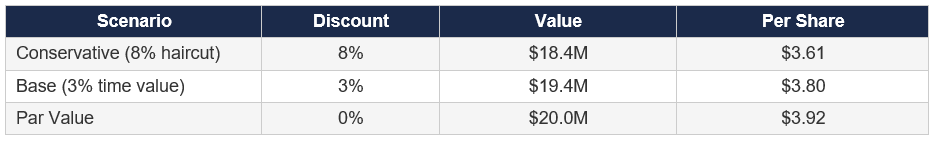
Assessment: $18.4–$20.0M = $3.61–$3.92/share
Government-backed receivable with repayments commenced. Near-cash asset with 1–2 year collection horizon. The Q4 2025 payment is proof of mechanism. We use $19.0M ($3.73/share) as our base case.
Asset 3: Equity Investments — Joint Venture Portfolio ($5.2M Book / $15–$22M Fair Value)

This is the most complex and most undervalued asset on the balance sheet. The equity investments line of $5,155,644 represents Canterbury’s aggregate book value interest in four joint ventures, after years of cumulative equity-method losses. These accounting losses are driven primarily by Canterbury’s proportionate share of depreciation, amortization, and interest expense from the Doran apartment ventures — non-cash charges that bear no relationship to the economic value of the underlying real assets.
Additionally, the “Investee losses in excess of equity investment” liability of $6,853,000 (as of mid-2025) represents Canterbury’s future capital contribution obligations under the Doran Canterbury I operating agreement. These are included as a contra-asset / liability on the balance sheet and further depress the apparent book value of the JV portfolio. Net of this obligation, the JV interests had a combined GAAP book value of approximately negative $1 million. This is an absurd misrepresentation of economic reality.
Doran Canterbury I (Phase I) — 27.4% Ownership
Asset Description
Phase I of the Triple Crown Residences at Canterbury Park is an upscale apartment complex consisting of approximately 300 units, a heated parking ramp, and a clubhouse. Canterbury contributed approximately 13 acres of land on September 27, 2018 as its equity contribution. Doran Companies handled all construction, financing, and property management.
Operating Status
Phase I experienced a serious setback when its fire sprinkler system failed inspection in late 2023, requiring remediation, relocations, and re-inspections that pushed occupancy back by 12–18 months. Repairs were completed in late 2024 with a certificate of occupancy granted in early 2025. As of December 31, 2025, Phase I was 67% leased, up from 42% at mid-year 2025 and 0% during the remediation period. The leasing trajectory is positive and accelerating.
Equity-Method Losses (Non-Cash Distortion)
For FY2025, Canterbury recorded a loss of $2,739,000 on this venture (down from $3,552,000 in FY2024). The decreased loss reflects improving occupancy. These losses are dominated by Canterbury’s 27.4% share of depreciation and interest expense on the development’s construction financing. As the property leases up and NOI covers debt service, these losses will narrow and eventually convert to income.
Fair Value Estimate
Comparable evidence: The Twin Cities apartment market is stabilizing favorably. Per NorthMarq’s February 2026 market report, the Minneapolis–St. Paul median multifamily sale price reached $196,600 per unit in 2025, driven by Class A and B urban acquisitions. Market-wide vacancy declined to 4.3% with average rents exceeding $1,600/month. Cap rates for stabilized Class A suburban properties range from 4.75% to 5.50% in the Minneapolis metro area.
At 300 units and a conservative estimated enterprise value of $175,000–$225,000 per unit (discounting the median due to suburban location and ongoing lease-up), the total property value is $52.5–$67.5 million. Canterbury’s 27.4% share of equity, net of the property’s construction financing (estimated at $50–60 million based on typical 70–75% LTV construction loans on a $70M+ development), yields an estimated equity value to Canterbury of $0.7–$2.1 million at current occupancy. However, at full stabilization (95%+), the equity value rises materially as NOI supports debt service and generates positive distributions. We estimate a stabilized equity value to Canterbury of $3–$6 million, discounted to present value at $2–$5 million given the 12–18 month remaining lease-up timeline.
Doran Canterbury II (Phase II) — 27.4% Ownership
Asset Description
Phase II is the second phase of the Triple Crown Residences, developed on approximately 10 acres of land contributed by Canterbury on September 30, 2020 (exchanged for a 27.4% equity interest plus repayment of a $2.9 million note receivable). Construction began in March 2022 with initial occupancy in January 2024.
Operating Status
This is the crown jewel of the JV portfolio. Phase II reached 94% occupancy by December 31, 2025, and successfully refinanced in January 2026. The refinancing is a critical validation event: it means a third-party lender underwrote the property at a value supporting new permanent financing, implying a formal appraisal at or above the existing construction loan balance. Refinancing at 94% occupancy indicates the property has effectively reached stabilization.
Fair Value Estimate
Phase II is a newer, more modern property than Phase I, with no history of construction defects. At stabilized occupancy, this is a Class A suburban multifamily asset in a market where such properties trade at 4.75–5.25% cap rates. If we assume approximately 250–280 units (proportional to acreage vs. Phase I), an enterprise value of $200,000–$250,000 per unit yields a total property value of $50–$70 million. At 27.4% of equity (after senior debt), Canterbury’s interest is worth an estimated $4–$7 million. The January 2026 refinancing validates that the equity is real and unimpaired.
Phase II Refinancing: Why This Matters
A refinancing at 94% occupancy means a bank appraised the property, underwrote the debt service, and determined the asset supports permanent financing. This is not a management estimate — it is third-party validation of the underlying real estate value. Banks do not refinance underwater assets. The positive equity cushion implicit in the refi directly contradicts the depressed GAAP carrying value on Canterbury’s books.
Canterbury DBSV Development, LLC — 61.87% Ownership
Asset Description
The DBSV venture with Greystone Construction develops the southwest portion of Canterbury Commons. Canterbury contributed 13 acres of land valued at approximately $261,000 per acre ($3.4 million total) for its 61.87% equity interest. The development includes: (a) The Omry at Canterbury, a 147-unit senior market-rate apartment building; (b) a 28,000 sq. ft. commercial office building completed in October 2025; and (c) a 10,000 sq. ft. commercial building housing a pizza restaurant, fitness center, and BBQ restaurant.
Operating Status
The Omry: 99% leased as of year-end 2025 (up from 95% at mid-year). At 147 units and near-full occupancy, this is a stabilized, cash-flowing asset generating market-rate rents to a senior demographic in a high-demand submarket. The 28,000 sq. ft. office building: 66% leased as of year-end 2025, with the company noting “strong interest for the remaining space.” The commercial retail building: all three tenants (pizza, fitness, BBQ) completed their first year of business with positive patronage.
Fair Value Estimate
The Omry alone, at 147 units of stabilized senior housing, is a valuable asset. Using a conservative $175,000/unit valuation (lower than Class A given senior demographic), the property is worth approximately $25.7 million. Net of financing (estimated $15–18 million at 60–70% LTV), the equity value is $7.7–10.7 million. Canterbury’s 61.87% share yields $4.8–$6.6 million from The Omry alone.
The office and retail components add incremental value, though they are still stabilizing. At a conservative 7–8% cap rate on estimated stabilized NOI, these commercial assets contribute an additional $1–$2 million of equity value to Canterbury’s interest. Total DBSV estimated value to Canterbury: $5–$8 million.
Trackside Investments, LLC — 50% Ownership
This JV developed the Boardwalk Kitchen and Bar, a 6,000 sq. ft. upscale restaurant and bar with an 18,000 sq. ft. patio offering trackside views. The venue opened in summer 2025. While still in its first year, management reported positive patronage. We value Canterbury’s 50% interest conservatively at $1–$2 million, reflecting the replacement cost of the buildout, the prime location, and the early positive revenue trajectory. The amphitheater opening in June 2026 should provide a significant demand boost.
Aggregate JV Portfolio Valuation
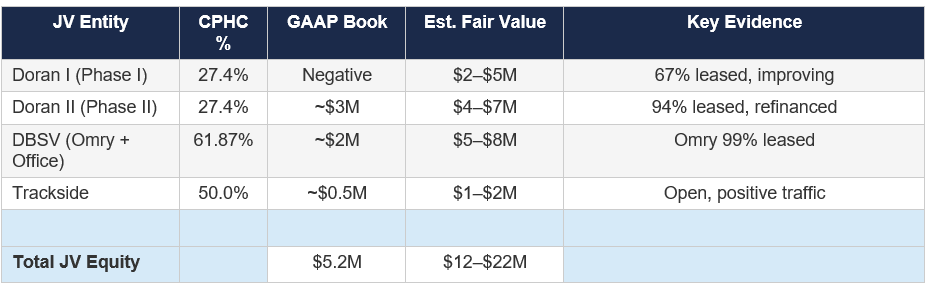
To this we add the Related Party Receivable of $5,959,601 (member loans to JV entities) and Other Long-Term Receivables of $2,097,463, both of which will be repaid as the JVs generate positive cash flow. Total JV-related value to Canterbury including loans: $20–$30 million, versus a GAAP book value of approximately $13 million across all related line items.
Assessment: JV Portfolio Fair Value $20–$30M total (including member loans)
GAAP equity-method accounting creates an enormous distortion. Non-cash depreciation and interest expense drive reported losses that mask the economic reality of stabilizing, valuable multifamily and commercial real estate. The Doran Phase II refinancing in January 2026 provides hard third-party validation. At stabilization, this portfolio should generate positive equity-method income and potentially cash distributions.
Asset 4: Land Held for Development ($2.7M Book / $12–$18M Fair Value)
The Book-to-Market Gap
This is the most dramatic example of historical-cost distortion on Canterbury’s balance sheet. The company carries approximately 50 acres of entitled development land at a book value of $2,659,257 — approximately $53,000 per acre. The market value of this land is many multiples of the book value.
Comparable Transaction Evidence
Three directly relevant transactions establish a price floor for Canterbury’s remaining acreage:
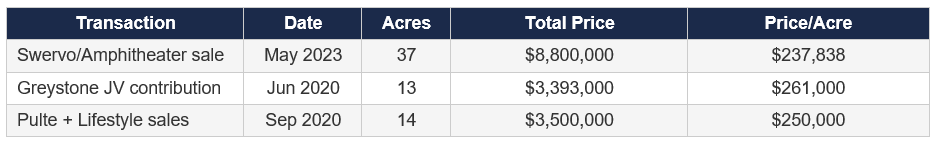
These transactions establish a floor of $237,000–$261,000 per acre for Canterbury Commons land. Critically, all three transactions occurred before the most significant value-enhancing developments materialized: the amphitheater construction, the road infrastructure completion, the achievement of critical residential density (1,000 units), and the build-out of commercial and restaurant amenities. The remaining 50 acres are more valuable today than the parcels sold in 2020–2023, for several reasons:
• The 19,000-seat Live Nation amphitheater opens in June 2026, creating an anchor entertainment destination that will draw hundreds of thousands of visitors annually to the immediate area.
• Canterbury completed road infrastructure adjacent to the amphitheater, unlocking approximately 25 acres of prime development land that previously lacked access.
• The existing development (1,000 residential units, restaurants, office space) creates a critical-mass flywheel effect: each successive development phase increases demand for the next.
• Shakopee’s population has grown 14.7% since the 2020 census (44,073 to 50,565 in 2026), and the Metropolitan Council projects 43% growth through 2050, reaching 62,500 residents.
• New multifamily construction costs in the Twin Cities now average $300,000–$350,000 per unit, making entitled, infrastructure-ready land increasingly scarce and valuable.
Segmented Valuation
Not all 50 acres are equal. We segment the land into two tranches:
Tranche A: ~25 acres adjacent to the amphitheater. Management has engaged Hunden Partners to conduct a highest-and-best-use analysis. These parcels benefit directly from Live Nation traffic and are candidates for hotel, entertainment, and hospitality uses. Comparable entertainment-district land in growing suburban markets transacts at $300,000–$500,000+ per acre. We conservatively estimate $300,000–$400,000 per acre, yielding $7.5–$10.0 million.
Tranche B: ~25 acres of remaining developable land. These parcels are suited for additional residential, office, or mixed-use development. At the prior transaction floor of $237,000–$261,000 per acre, these are worth $5.9–$6.5 million.
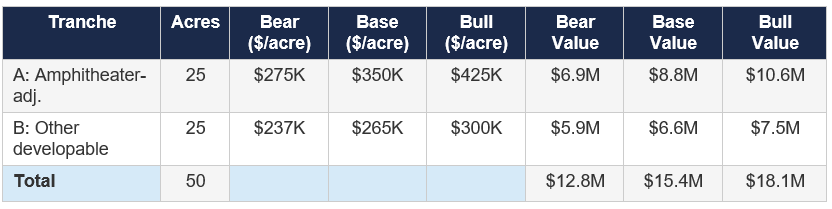
The Hidden $10–$15 Million
Canterbury’s 50 acres are carried at $2.7M. Even the most conservative market-based valuation yields $12.8M. The difference — $10–$15 million, or $2.00–$3.00 per share — is invisible on the balance sheet and entirely unrecognized by the market. This is the essence of the mispricing.
Asset 5: The Operating Business — Racetrack, Casino, and F&B
Revenue and EBITDA Profile
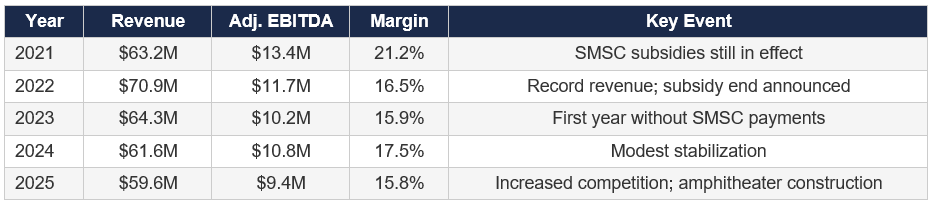
The operating decline from $13.4M to $9.4M in EBITDA reflects two structural shifts: (a) the expiration of the SMSC Cooperative Marketing Agreement in December 2022, which eliminated purse enhancement and marketing payments that had supported racing purses and traffic; and (b) increased regional gaming competition. Importantly, Q4 2025 showed sequential improvement, with EBITDA rising 52.8% year-over-year to $2.3 million, driven by 5.4% casino revenue growth and improving visitation trends.
Comparable Valuation Framework
Recent gaming transaction and trading multiples provide the valuation anchor:
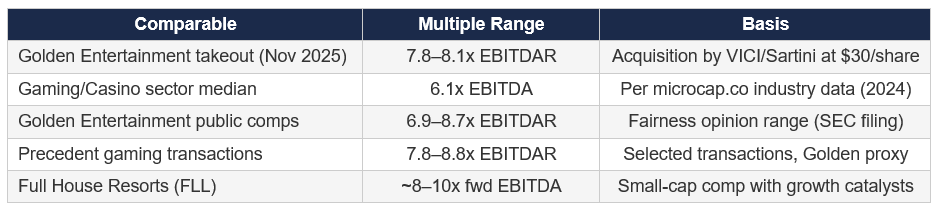
Canterbury’s operating business warrants a discount to the broader gaming sector for several reasons: it is an unbanked card casino (no slots, lower revenue per visitor), it is structurally prohibited from offering historical horse racing machines or expanded gaming, and it competes directly with Mystic Lake, one of the largest tribal casinos in the country. We apply a 6–8x EV/EBITDA range, reflecting the monopoly license value and stable (if declining) cash flow on the high end, and the structural regulatory ceiling on the low end.
An important bull-case consideration: the Live Nation amphitheater’s opening in June 2026 could meaningfully inflect casino traffic. A 19,000-seat venue hosting 40–60 shows per season would bring 500,000–750,000 incremental visitors to the campus annually. If even 5–10% of those visitors stop at the casino or F&B outlets, the revenue impact could be $2–4 million annually, potentially adding $1–2 million to EBITDA. At 7x, that’s $7–14 million of incremental enterprise value — for free at the current stock price.
The Monopoly License Premium
Canterbury holds Minnesota’s only thoroughbred racing license and the associated card casino authorization. This license is irreplicable — no amount of capital can create a competing facility. State law and tribal lobbying have foreclosed expanded gaming. Even at the depressed current EBITDA run-rate, a monopoly gaming license with permanent authorization to operate card games 24/7 in a metro area of 3.8 million people has significant franchise value that commands a premium to liquidation value.
Consolidated NAV: Bear / Base / Bull
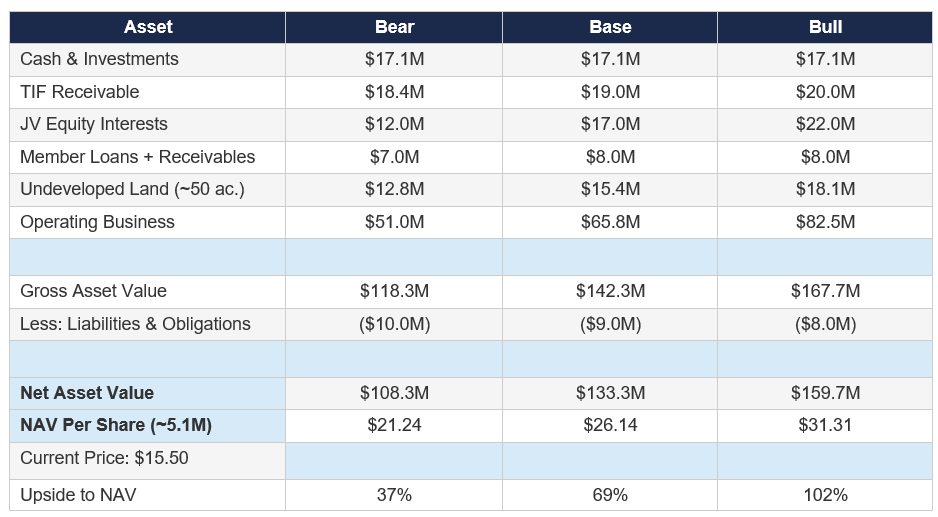
Liabilities and Offsets
Canterbury has zero traditional debt. The liabilities deducted in the NAV include: accounts payable (~$3.7M), casino accruals (~$2.2M), accrued wages (~$2.2M), payable to horsepersons (~$0.9M), deferred revenue (~$0.3M), and the investee losses in excess of equity investment liability (~$6.9M, representing future Doran I capital contributions). In the bear case, we assume slightly higher effective liabilities to account for unrecorded obligations or contingencies.
The Implied Operating Business Value: Evidence of Extreme Mispricing
We can now perform the exercise that reveals the depth of the market’s mispricing. By subtracting the estimated fair value of all balance sheet assets from the current market capitalization, we derive the market’s implied valuation of the operating business:
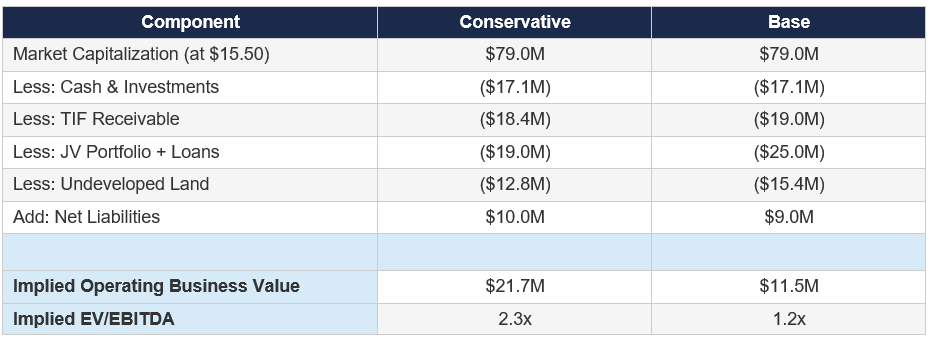
Even using the most conservative estimates for each balance sheet asset, the market is implying the operating business is worth $21.7 million, or just 2.3x EBITDA. Using our base case, the implied value drops to $11.5 million, or 1.2x EBITDA. Both figures are absurdly low for any cash-generating business, let alone one with a monopoly gaming license in a 3.8-million-person metro area.
Absurdity Check
No rational buyer would sell a monopoly gaming license generating $9.4M in annual cash flow for 1–2x EBITDA. The Golden Entertainment takeout occurred at 7.8–8.1x. Even deeply distressed casino assets in bankruptcy rarely trade below 4x. The only explanation for this valuation is that the market assigns zero or negative value to the non-operating assets — which is demonstrably incorrect.
True Market Value of the Land and JVs: A Standalone Analysis
Investors sometimes ask: “If we could separate the real estate from the gaming business, what would the development portfolio be worth as a standalone entity?” Here is that analysis:
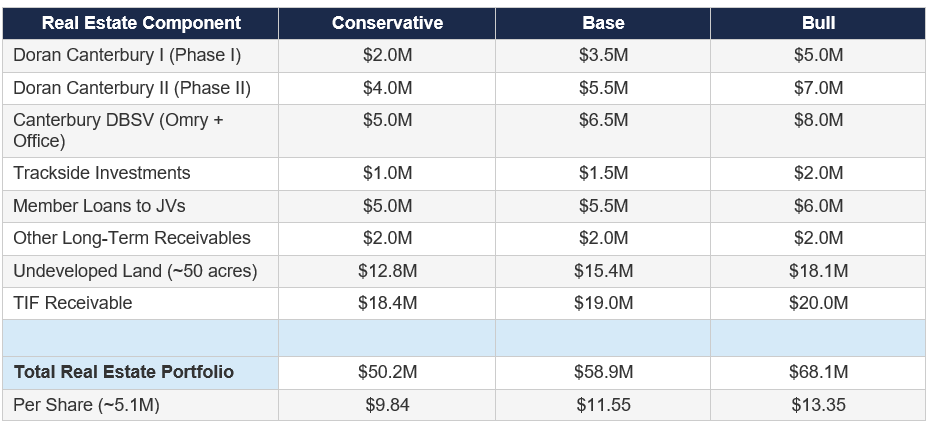
The real estate portfolio alone is worth an estimated $50–$68 million, or $9.84–$13.35 per share. This means the current stock price of $15.50 implies the market is valuing the entire operating business — Minnesota’s only racetrack, its 24/7 card casino, its food and beverage operations, and its monopoly gaming license — at roughly $1–6 per share, or $5–30 million. Even in the most conservative scenario, this is a gross undervaluation.
Scenario Analysis and Sensitivity
Scenario 1: Status Quo (No Catalysts)
Operating EBITDA remains at $9–10M, JVs slowly stabilize, TIF is collected by 2027, no new development deals. Value accumulates quietly through balance sheet growth. Expected NAV: $22–25/share over 2–3 years. Annualized return: 15–20% including dividends.
Scenario 2: Amphitheater Success + New JV Deals
Amphitheater drives $1–2M of incremental EBITDA. Management announces JV partnerships for amphitheater-adjacent land (hotel, entertainment). JVs turn profitable on GAAP basis. Market re-rates the stock as “entertainment district + gaming” rather than “declining racino.” Expected NAV: $26–31/share within 12–24 months. Annualized return: 30–50%.
Scenario 3: Strategic Transaction
Sampson (20% owner) and private equity pursue a going-private transaction, real estate spin-off, or sale-leaseback. A take-private at 7x operating EBITDA plus fair value of real estate assets would imply a price of $25–32/share. A real estate spin-off would force the market to value each business independently, likely closing the NAV discount. Expected value: $25–35/share. Catalysts: continued low stock price, activist pressure, succession planning.
Downside Scenario: What Would Need to Go Wrong
Operating EBITDA declines to $7M, JV lease-up stalls, TIF collections are delayed, land remains undeveloped. Even in this scenario, the balance sheet provides a floor: $17M cash + $20M TIF + $12M JV (conservative) + $12M land (at prior transaction floor) = $61M, or $12/share in hard asset value. The downside from $15.50 is roughly $3.50/share, or 23%, while the upside in the base case is $10.50/share, or 68%. The risk/reward ratio is approximately 3:1 in favor of the long.
Conclusion: The Evidence is Overwhelming
Every major asset on Canterbury’s balance sheet is demonstrably undervalued by the market. Cash is fully visible but still discounted (the stock trades below book value). TIF receivables have been validated by actual cash collection. JV equity interests are obscured by non-cash GAAP losses, but the Phase II refinancing provides hard third-party validation. Undeveloped land is carried at $53,000 per acre when comparable transactions support $237,000–$350,000+. And the operating business — a monopoly gaming license generating $9.4 million in annual EBITDA — is implicitly valued at 1–2x EBITDA after stripping out the balance sheet assets.
The aggregate evidence points to a NAV of $21–31 per share across our scenario range, with a base case of approximately $26 per share. At $15.50, the market is offering a 40%+ discount to the most conservative NAV estimate. With multiple near-term catalysts (amphitheater, TIF cash flow, JV stabilization, new development announcements), the probability of value realization within 12–24 months is high.
The margin of safety is real. The asymmetry is compelling. The evidence is in the SEC filings, the comparable transactions, the refinancing, and the property tax payments. The market simply has not done the work.