
Alexandria Real Estate (ARE): An Asymmetric Setup in Irreplaceable Life Science Real Estate
Cambridge, Mission Bay, and Torrey Pines at 40 cents on the dollar - and a former Blackstone Real Estate executive is quietly buying

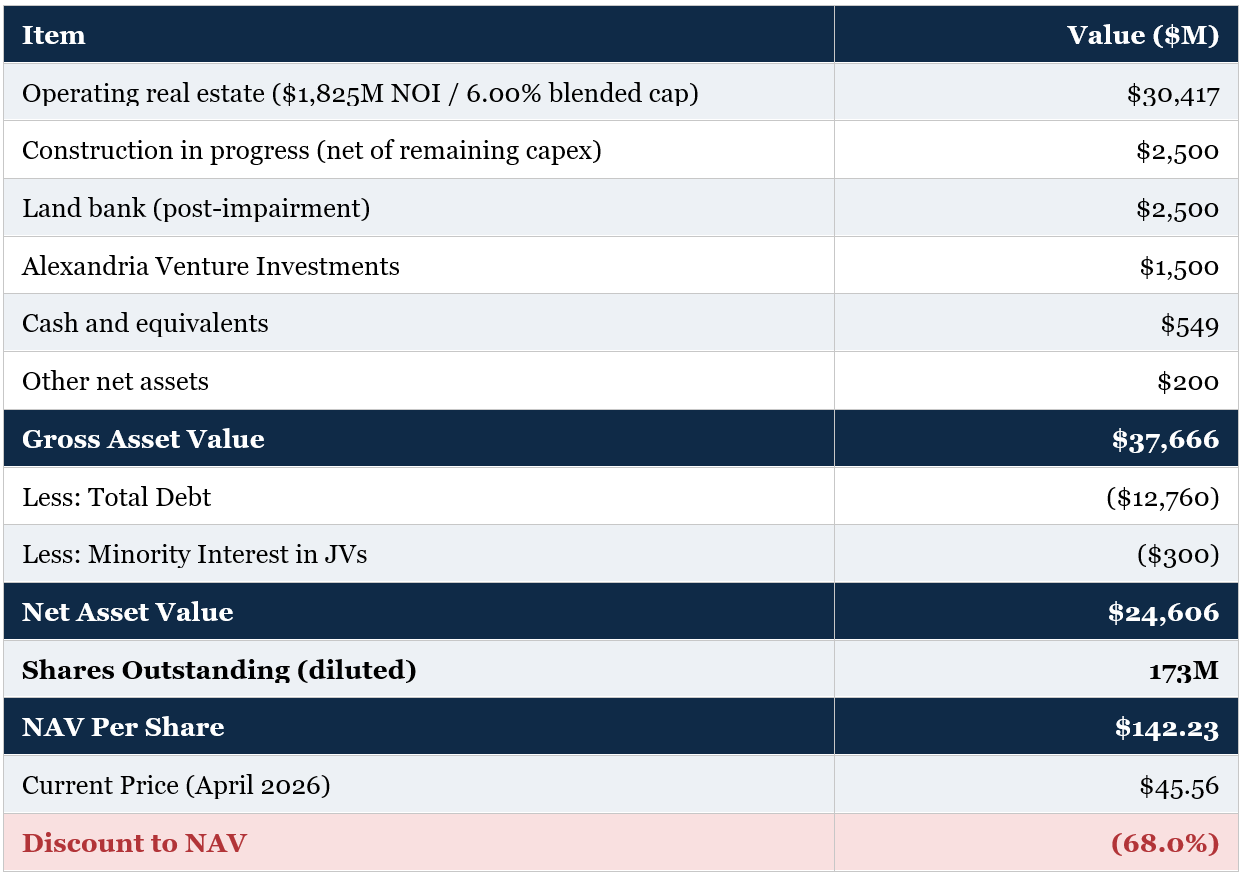
The market is pricing Alexandria’s portfolio at an implied 13% capitalization rate - a level that has no precedent in private market transactions for Class A or A+ life science assets in core innovation submarkets. Reconciling the current share price to observable private market transactions requires a permanent impairment scenario. The market is pricing an irreplaceable real estate platform as if it were a distressed commodity portfolio, and the disconnect is unusually large. Our base case Net Asset Value is approximately $130 per share - nearly 3x the current price.
Alexandria Real Estate Equities (NYSE: ARE) is the largest owner and operator of life science laboratory real estate in the United States, with 35.8 million rentable square feet of operating properties and an additional 3.4 million RSF under construction, concentrated in the most supply-constrained innovation clusters in North America - Greater Boston, the San Francisco Bay Area, and San Diego, which together generate approximately 71% of annual rental revenue. The stock last traded at ~$45, down approximately 48% over the trailing twelve months and roughly 78% from the 2022 peak above $200. At that price, the equity market capitalization is $7.9 billion. Adding $12.76 billion of debt and $0.3 billion of minority interest, total enterprise value is approximately $20.4 billion.

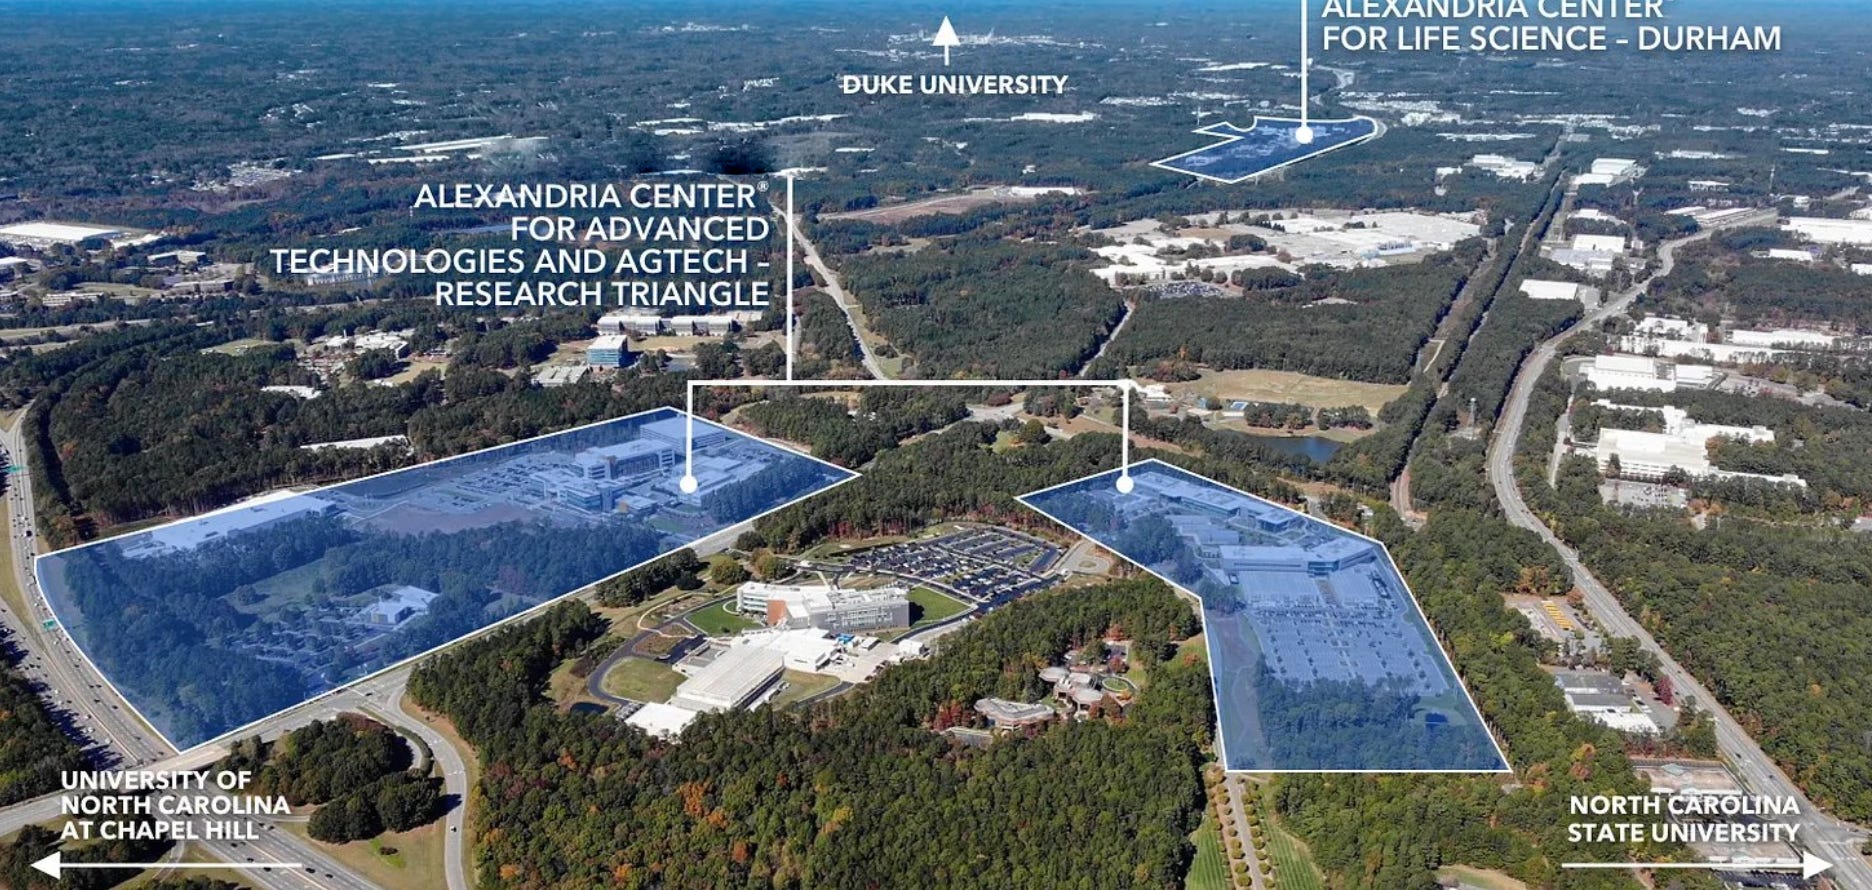
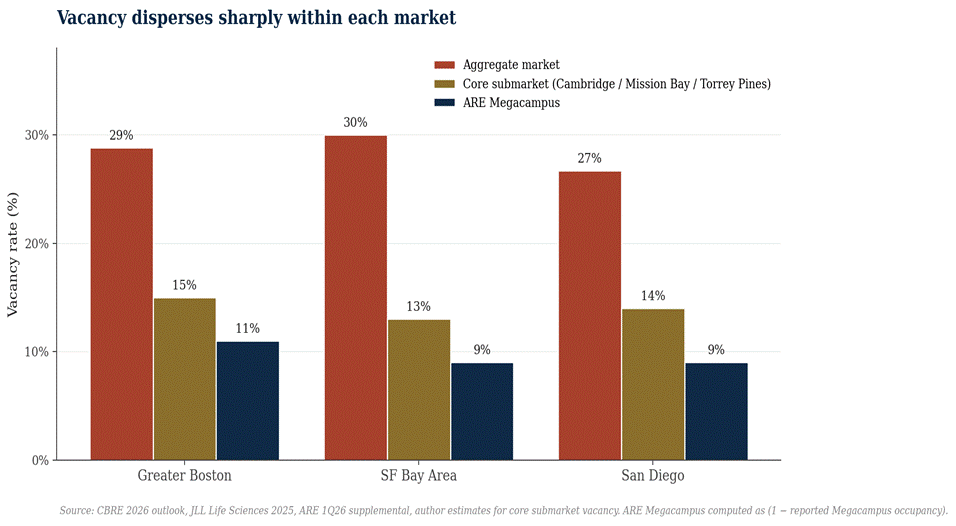
The portfolio breaks into two operating buckets and one non-operating bucket. The first operating bucket is the Megacampus core: roughly 27.9 million rentable square feet generating approximately 78% of annual rental revenue, concentrated in the irreplaceable innovation submarkets of Cambridge, Mission Bay, South San Francisco, Torrey Pines, and University Town Center. Each of these submarkets is defined by physical proximity to the academic research institutions that anchor U.S. biotechnology - MIT and Harvard in Cambridge; UCSF, Stanford, and Berkeley in the Bay Area; UCSD and Scripps Research in San Diego - and by the deepest concentrations of biotech venture capital. These campuses are operating at approximately 91% occupancy against broader market vacancies in the mid-twenties - a sustained outperformance of approximately 1,500 to 1,800 basis points that reflects the brand premium, network effects of cluster economics, and operational quality of the platform. The Megacampus core is genuinely scarce real estate: the underlying land was assembled over decades, the cluster economics that drive tenant demand cannot be recreated in alternative geographies, and the cost economics of new construction at $1,400 to $1,800 per rentable square foot make replacement supply uneconomic for the foreseeable future.

The second operating bucket is the non-Megacampus tail: approximately 7.9 million rentable square feet across Maryland, Research Triangle, Seattle, New York, and assorted other positions, generating the remaining 22% of annual rental revenue. Quality varies meaningfully within this bucket - the Eastlake assets in Seattle and certain Manhattan positions on the East River are high-quality; parts of Gaithersburg, Rockville, and Research Triangle outparcels behave closer to commodity specialized real estate. The disposition program targets $2.9 billion of asset sales in 2026, weighted heavily toward this tail.
The non-operating bucket is the layer of capital deployed in development and venture activity that does not currently generate income. Construction in progress includes approximately 3.4 million RSF of pre-leased Class A and Class A+ projects with roughly $1.2 billion of remaining capital expenditures required for completion. The land bank and pre-development pipeline, which had grown to approximately $4.2 billion of capitalized basis by mid-2025, took $1.45 billion of impairment in the fourth quarter; the residual post-impairment carrying value is approximately $2.75 billion, the majority in core markets. Alexandria Venture Investments adds another estimated $1.5 to $2.0 billion in book value across roughly 200 portfolio biotech companies. Together, this non-operating bucket represents approximately $4.5 to $5.0 billion of asset value that the public market is currently assigning negligible or negative incremental value.

The capital structure provides meaningful flexibility through the cycle. Total debt of $12.76 billion sits at a 10-year weighted-average maturity, the longest in the S&P 500 REIT universe, with only 9% maturing through 2028. The unsecured debt carries investment-grade ratings of Baa1 (Moody’s) and BBB+ (S&P), both affirmed post-impairment - independent validation that the credit fundamentals remain intact through the cycle. Total liquidity is $4.17 billion. There is no meaningful preferred stock outstanding. Net debt plus preferred to Adjusted EBITDA stands at 6.8x on first-quarter 2026 annualized - above the company’s target band of 5.6x to 6.2x, which management has guided to reach by year-end 2026 contingent on disposition execution. The dividend was cut 45% in the third quarter of 2025; current annualized payout is $2.88 per share, yielding approximately 6.3% at the current price.
At ~$45, the equity trades at approximately 0.35x book value, 7.1x 2026E FFO (against a long-term historical average closer to 18x to 22x), and an implied 12% to 13% capitalization rate on the operating real estate. The last metric is the one that matters most for the thesis, because it is the data point most directly testable against observable private market evidence - and the data point most clearly inconsistent with that evidence.
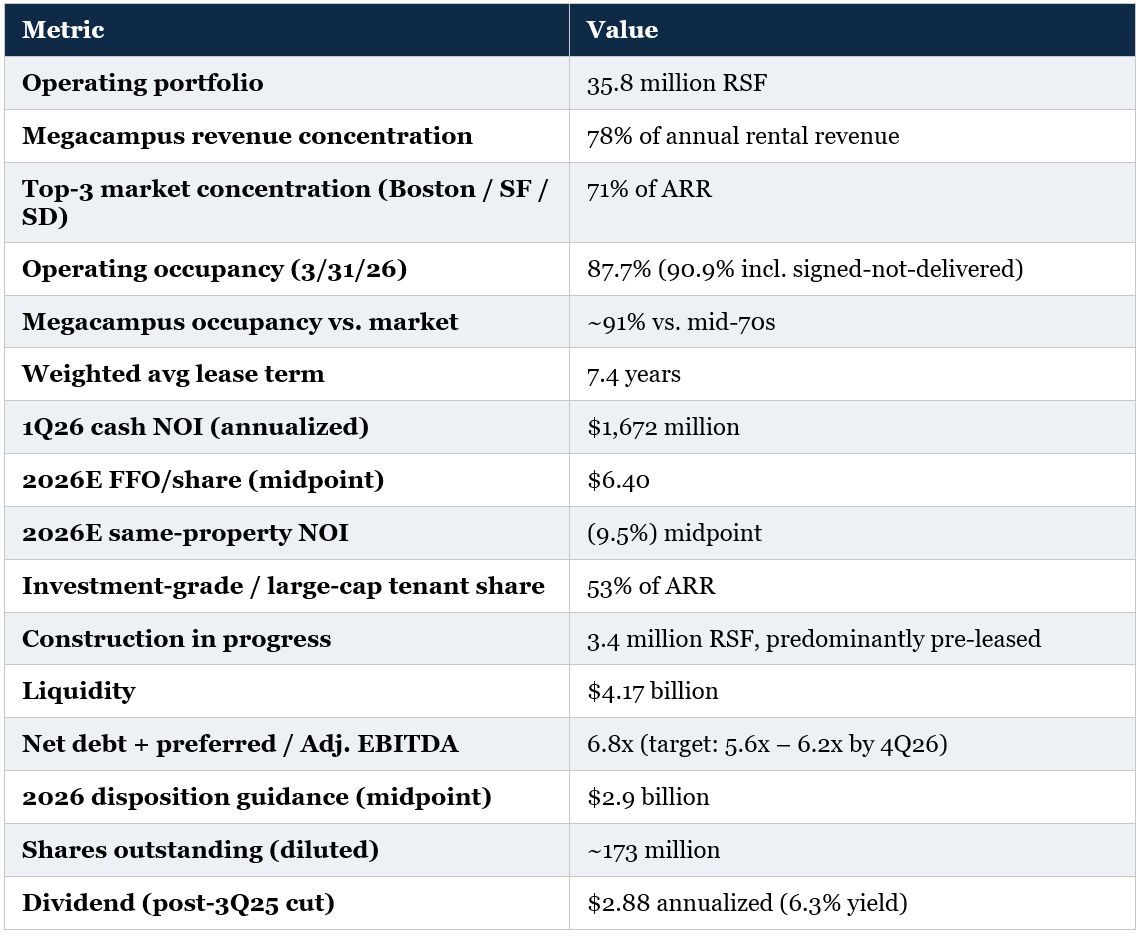
Quick reference
Anatomy of a 60% discount
Markets do not produce 60% discounts to asset value without reasons. The relevant question is whether the reasons reflect permanent business impairment or sequential cyclical events that have largely run their course. The trajectory from 2022 to 2026 is worth walking through in some detail because the timing of when each pressure was added to the discount matters for thinking about when each pressure could come off.
Through mid-2022, Alexandria traded at $200+ per share, an FFO multiple north of 25x, and an implied cap rate in the high-4% range - fully consistent with what private market transactions were clearing at the time. The setup combined three favorable forces: a record biotech IPO and venture capital cycle, declining cap rates across all commercial real estate as the 10-year Treasury sat near 1.5%, and a long-running structural narrative around life science demand growth that the public market accepted without much scrutiny.
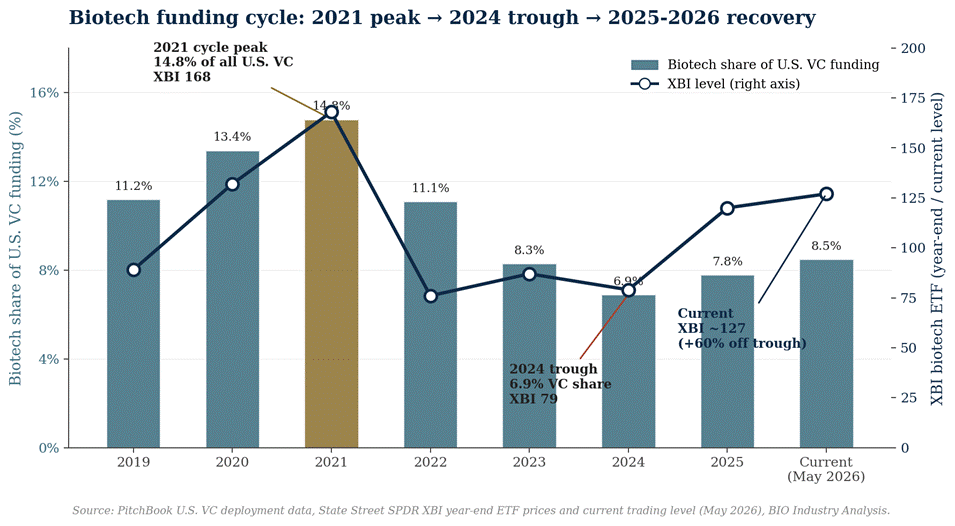
From mid-2022 through 2023, the cycle began to unwind. Biotech venture capital declined from roughly 15% of total U.S. VC deployment to closer to 7%. Public biotech valuations collapsed. The 10-year Treasury yield climbed from 1.5% to above 4.5%. Cap rates across all real estate sectors widened. Alexandria’s stock declined to roughly $110, an FFO multiple in the mid-teens, and an implied cap rate moving toward 6%. None of this was Alexandria-specific. It was the broader REIT and biotech complex revaluing under higher rates and tighter capital.
The second leg of the decline, which dominated 2024 and 2025, was the unwinding of speculative supply. Lab construction starts from 2021 and 2022 - projects underwritten at peak demand and peak rents - began delivering into a softening market in 2023 through 2025. Aggregate U.S. lab vacancy rose from sub-5% to 23-27%. Boston reached 28.8% by year-end 2025. The San Francisco Bay Area passed 30%. San Diego reached 26.7%. Market rents corrected. New leasing volume slowed sharply. Public biotech leasing - historically a meaningful marginal demand source - declined to near zero by early 2026.
The supply pressure was not coincidental. It reflected the natural lag between underwriting decisions made at the 2021-2022 peak and physical delivery 18 to 30 months later. The encouraging dynamic for the forward view is that the same lag now works in reverse: construction starts have collapsed since 2023 to a seven-year low, which means physical supply additions through 2026, 2027, and 2028 will be sharply lower than the recent pace. This is the dynamic that allows vacancies to fall even at flat demand.
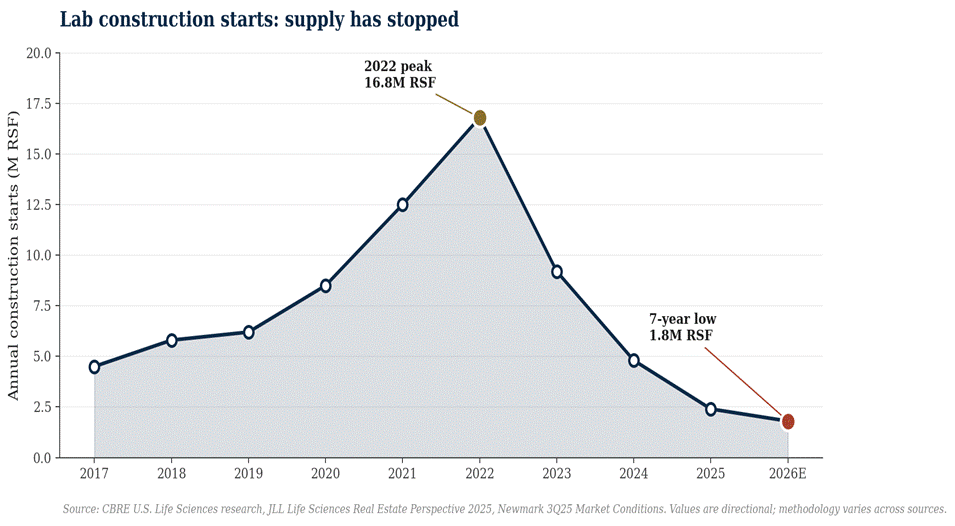
Lab construction starts collapsed from 16.8 million RSF in 2022 to a 7-year low of 1.8 million RSF in 2026, removing forward supply pressure.
The third leg, which compressed into a narrow window in late 2025 and early 2026, was Alexandria-specific credibility damage. In September 2025, the company cut its dividend 45%, from $1.32 quarterly to $0.72. In October 2025, it announced an initial $2.0 billion disposition guidance for 2026 that was subsequently raised to $2.9 billion at the December investor day. In December 2025, it pre-announced $1.45 billion of impairments to be taken in the fourth quarter, with the two largest individual writedowns at 88 Bluxome Street in South of Market and a Greater Boston land parcel together accounting for 37% of the total. In April 2026, it reported a first quarter with zero public biotechnology leases, operating occupancy down 320 basis points sequentially to 87.7%, and same-property NOI down 11.9% year-over-year.
Each of these was real. The dividend cut signaled cash flow pressure that prior guidance had not telegraphed. The impairments validated bear claims that the 2022-2024 speculative development pipeline had been over-extended. The zero-public-biotech-leases quarter was a striking data point on tenant demand weakness. The cumulative effect was the worst eighteen-month communication period in the company’s history.
The dividend has already been cut. The impairment cycle has likely already taken its largest single mark - the 88 Bluxome and Boston parcel writedowns were the most exposed individual positions in the land bank, and management has explicitly committed to reducing non-income-producing assets as a percentage of gross assets going forward. Construction starts across the broader market have fallen to a seven-year low, meaning the supply pressure that drove vacancies higher is dissipating. The first quarter of 2026 was almost certainly the trough quarter on occupancy: 1.1 million RSF of leased-but-not-yet-delivered space is scheduled to commence in the third quarter, mechanically driving occupancy higher into year-end.
The 60% discount, in other words, was added in roughly seven discrete tranches over four years. Each tranche had a specific catalyst. Most of those catalysts have now happened. The market is currently pricing as if more are coming. Some sophisticated real estate capital has already begun taking the other side - Town Lane, the firm founded by former Blackstone Real Estate Head of U.S. Acquisitions Tyler Henritze, has been actively accumulating Alexandria stock per recent 13F disclosures. The question is whether the next sequence of catalysts adds more discount, or starts to remove it. The accumulation pattern in informed real estate-specific capital is one early indication that it may be the latter.
Triangulating value: three independent frames
A bottom-up valuation is most useful when multiple independent analytical approaches converge on a similar answer. For Alexandria, three frames are available: an asset-by-asset capitalization rate approach anchored on the company’s NOI and submarket positioning, a replacement cost approach anchored on actual construction costs in core markets, and a private market transaction comparable approach anchored on observable trades in 2024 and 2025. All three converge on a range that is materially above the current public market valuation.
Frame one: submarket cap rate buildup
The starting point is normalizing the current depressed NOI. Alexandria reported $1,672 million of cash NOI on a first-quarter 2026 annualized basis at 87.7% operating occupancy. The relevant input for a Net Asset Value framework is not current trough NOI but normalized run-rate NOI through a representative operating environment. Four adjustments matter: the 1.1 million RSF of leased-but-not-yet-delivered space generates approximately $68 million of contractually committed incremental annual rent upon commencement; lease-up of currently vacant space to approximately 92% occupancy at recent cash mark-to-market spreads of negative 9% contributes roughly $80 million; contractual rent escalators averaging approximately 3% annually on the rolling lease base add another $30 million; and the 2027 expiration wave, with $97 million of annual revenue rolling at modestly negative spreads after some downtime, subtracts approximately $25 million on a run-rate basis.
NOI Bridge: Reported Cash NOI → Normalized Cash NOI
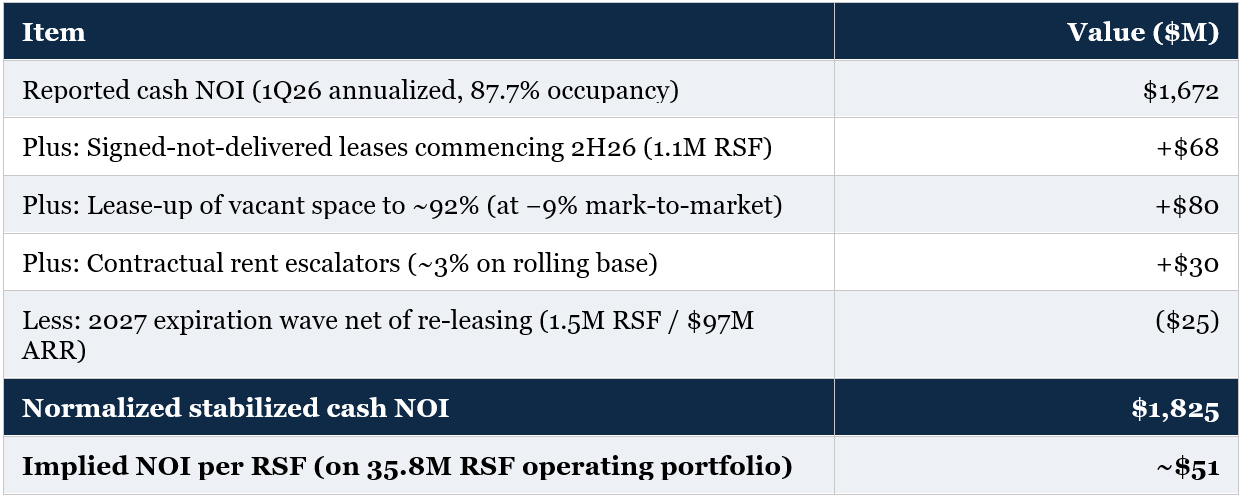
The aggregate yields normalized cash NOI of approximately $1,825 million - meaningfully above the trough quarter but below the 2024 peak. This corresponds to approximately $51 per rentable square foot on the 35.8 million RSF operating portfolio, consistent with blended in-place rents at approximately 92% occupancy. It is also well below the implied replacement rent of $90 to $130 per square foot triple net that would be required to justify new construction at current cost levels, which is the dynamic that constrains new supply for the foreseeable future.
Allocating normalized NOI across geographic markets and applying cap rates by submarket positioning, asset quality, and observed transaction evidence produces the following:
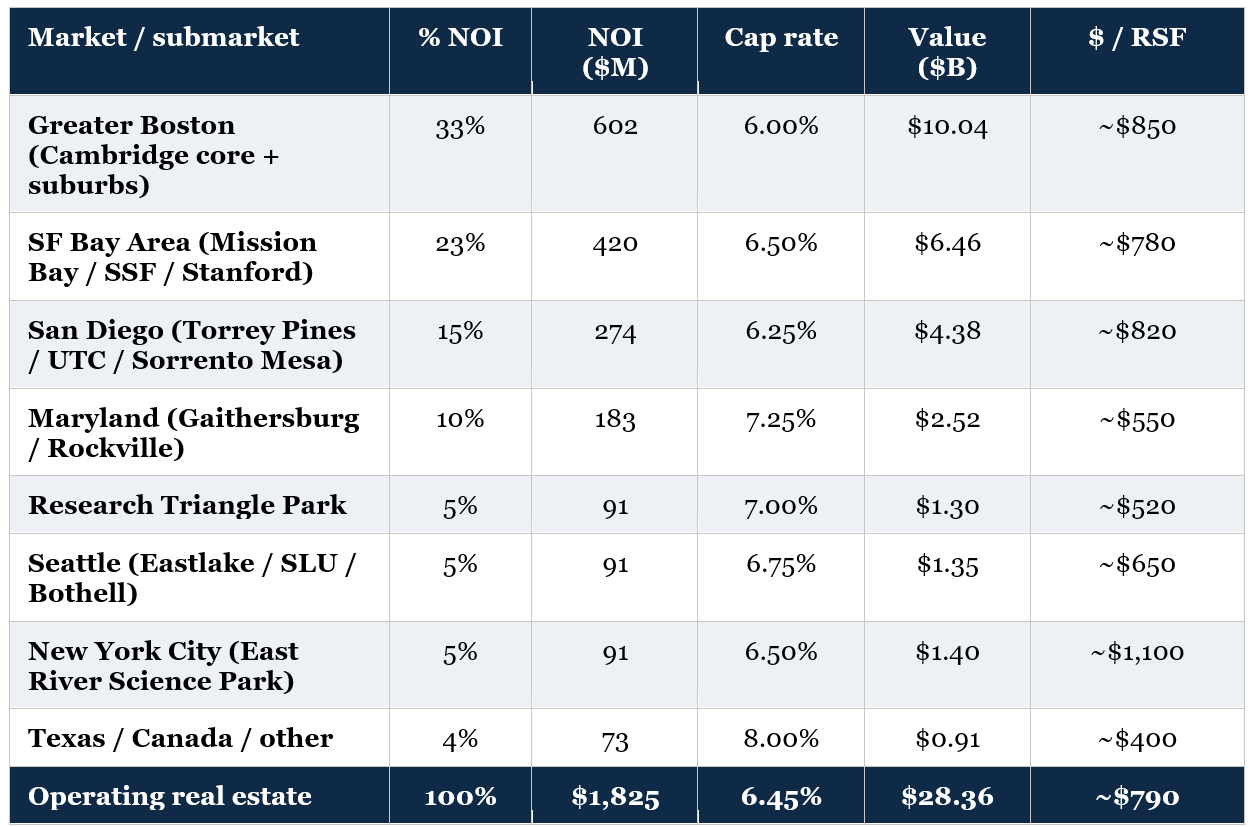
The cap rate assumptions sit modestly above first-half 2025 transaction averages reported by PwC, CBRE, and Newmark, with adjustments for Alexandria’s portfolio mix - which skews materially toward Class A and A+ Megacampus product in the strongest submarkets, where observed clearing rates have run 50 to 100 basis points tighter than the broader market average. The Greater Boston assumption at 6.00% reflects the concentration in Cambridge proper (Kendall Square, One Kendall, 215 First Street, the Alexandria Center at Kendall) where private market clearing has stayed in the 5.50% to 6.25% range even through the cycle. The San Francisco Bay Area at 6.50% reflects the blend of Mission Bay (which contains the highest-rent life science submarket in the country) and South San Francisco prime, with some weighting to the broader footprint where conditions are more variable. Maryland at 7.25% reflects the historical premium to core market cap rates given the lack of equivalent cluster economics in Gaithersburg and Rockville. The 6.45% blended portfolio cap rate is the resulting weighted average.
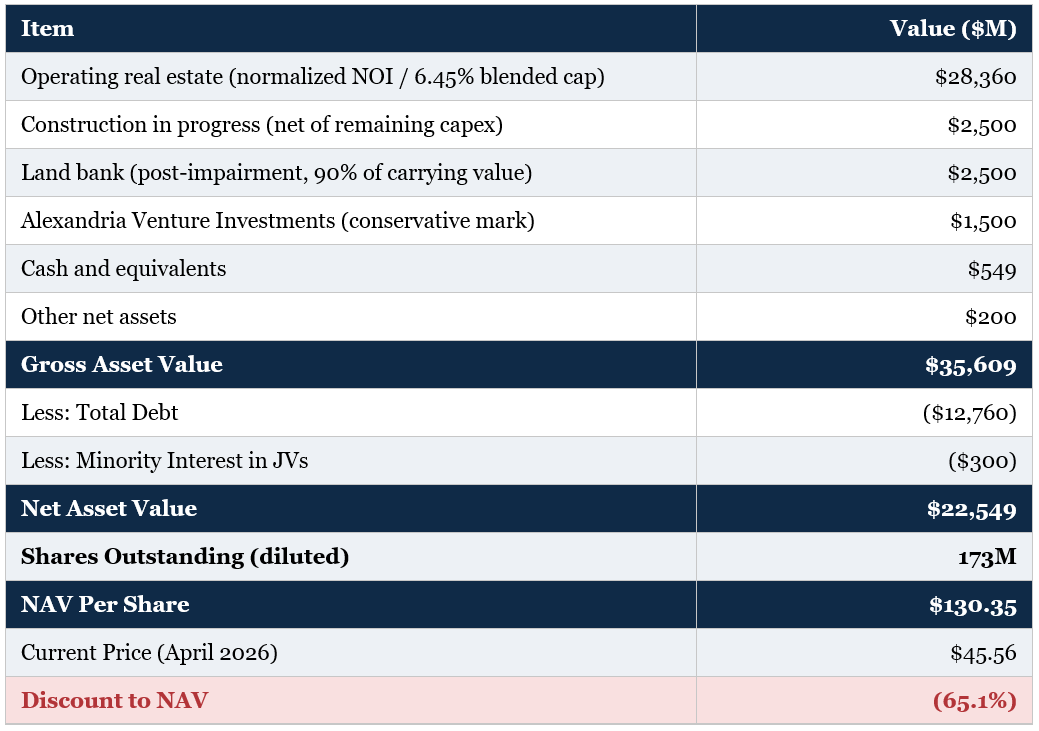
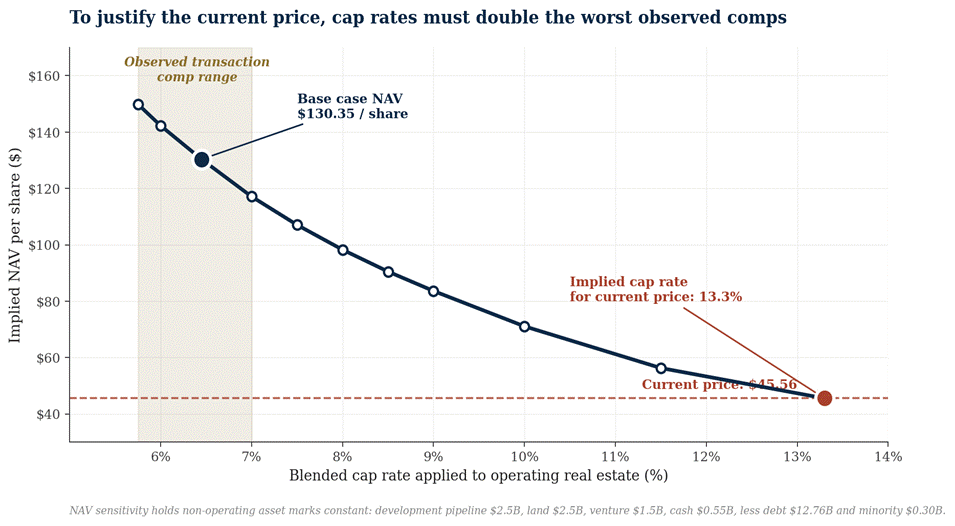
Adding in the development pipeline at $2.5 billion (net of remaining capital expenditures), the residual post-impairment land bank at $2.5 billion (approximately 90% of carrying value), Alexandria Venture Investments at $1.5 billion, cash of $0.55 billion, and other net assets of $0.2 billion, then subtracting total debt of $12.76 billion and minority interest of $0.3 billion, produces NAV of approximately $22.55 billion, or $130.35 per share.
NAV Walk - Frame One: Submarket Cap Rate Buildup (Base Case)
Frame two: replacement cost
All-in development cost for new Class A and Class A+ laboratory real estate in core markets is currently $1,400 to $1,800 per rentable square foot. This range comes from CBRE’s reporting that construction costs have risen 20% to 25% from pre-pandemic levels, combined with submarket-specific land acquisition costs in Cambridge, Mission Bay, South San Francisco, Torrey Pines, and University Town Center that have themselves remained elevated despite the cyclical downturn (because the existing land bank is permanently constrained).
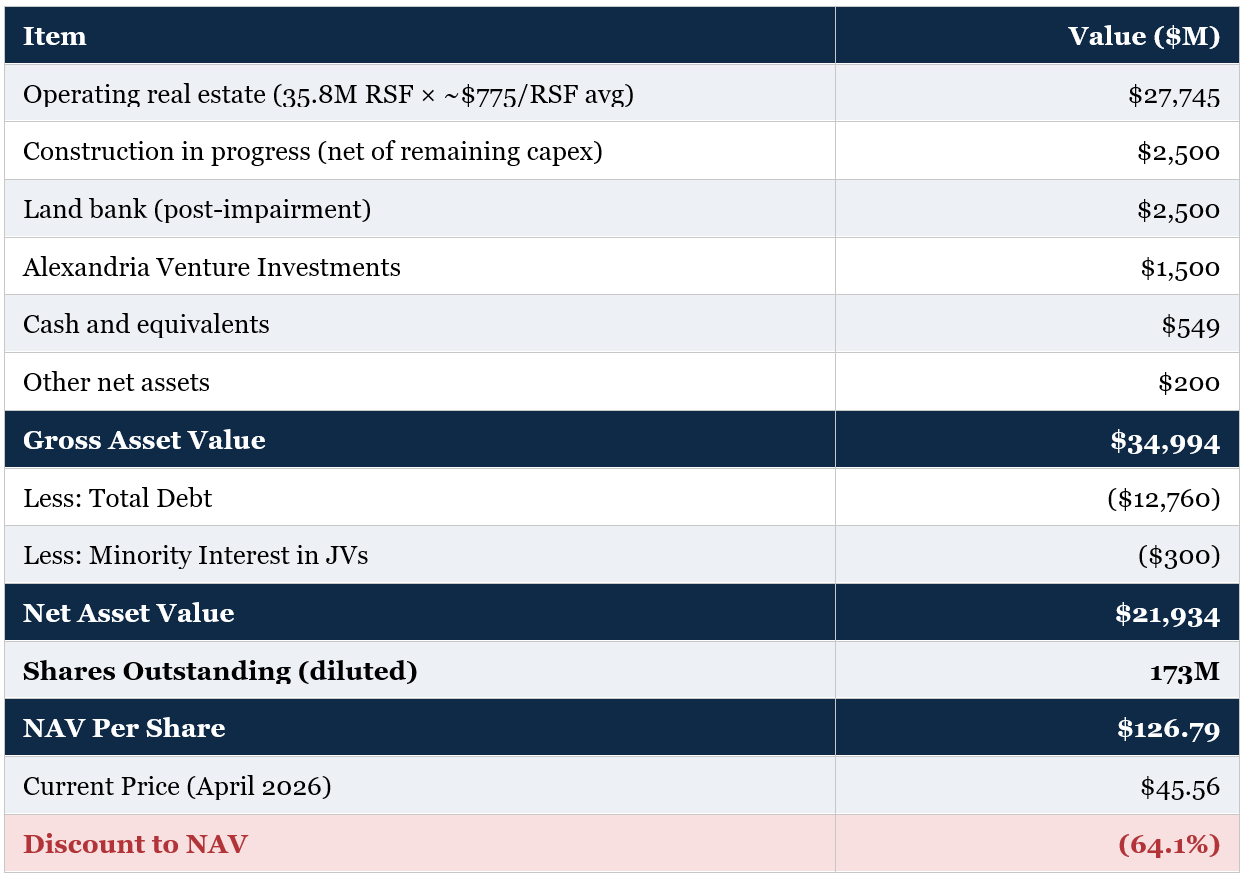
Alexandria’s 35.8 million RSF operating portfolio is, on average, lower-quality than brand-new Class A+ construction (the company has acquired and developed assets across multiple cycles, with some older vintage stock alongside the flagship Megacampus product). A reasonable estimate of average replacement cost across the operating portfolio is approximately $1,000 per RSF - discounting the headline new-construction cost to reflect the mix of older buildings. This implies aggregate replacement cost for the operating portfolio of approximately $35.8 billion.
At the current public market valuation, the implied per-RSF value of the operating portfolio is approximately $375 - after netting out the marks on construction in progress, land bank, venture portfolio, cash, and other net assets from total enterprise value. This represents approximately 37% of estimated replacement cost. Public market values below 50% of replacement cost are not stable equilibria over multi-year horizons: at marks meaningfully below half of replacement, the rational response from any rational owner is to operate existing assets at any economic rent, defer maintenance capex, and wait for the cycle to clear - because new construction is uneconomic and the existing inventory is effectively the entire market supply. The replacement cost floor argument implies a stabilized per-RSF value in the $700 to $850 range, corresponding to an operating real estate value of $25 to $30 billion. This is consistent with the cap rate approach.
NAV Walk - Frame Two: Replacement Cost (Midpoint at ~$775 / RSF)
Frame three: private market transaction comparables
The most direct frame is observable private market transactions. The 2024-2025 cycle produced a meaningful sample of trades that establish the actual clearing prices for life science assets.
CBRE and PwC reporting on first-half 2025 transactions showed life science capitalization rates averaging 6.6% on traded comparables across the market - itself elevated from the 4.4% trough in early 2022 - with Class A and A+ product in core submarkets clearing 50 to 100 basis points tighter than the average. Newmark’s third-quarter 2025 market conditions report flagged that M&A activity accelerated for the second consecutive quarter and that institutional capital continued to target high-quality R&D assets despite the broader cycle weakness.
Institutional capital is signaling conviction across three different layers of the capital stack, each of which carries distinct evidentiary weight. The first is the sector demand layer: Blackstone Life Sciences VI closed at $6.3 billion in March 2026, approximately 40% larger than its prior vintage. This is a biotech investment fund - it deploys directly into life science companies, not into real estate - but the implication for laboratory real estate demand is meaningful nonetheless. $6.3 billion of fresh growth and late-stage capital flowing into the same tenant base that occupies Alexandria’s portfolio compounds into more biotech program formation, more clinical-stage tenants, and more demand for laboratory space in the same Megacampus submarkets where the fund’s portfolio companies will need to operate. It is an indirect signal, but it is large and it is dispositive on the question of whether institutional capital has given up on the biotech sector.
The second signal is at the real estate equity layer, and it is more directly informative for the public ARE valuation. Town Lane, the private real estate investment firm founded by Tyler Henritze - formerly Head of U.S. Acquisitions at Blackstone Real Estate, where he was one of the most active institutional commercial real estate investors of the past decade - holds an approximately $40 million Alexandria position per its most recent 13F filing, with roughly $5 million of that position added in the latest reporting quarter. Henritze spent over a decade running the playbook of buying high-quality real estate at cyclical-low prices for the largest commercial real estate investor in the world. He has direct underwriting experience on the asset class. He is now building a position in the public ARE equity at current levels with his own firm’s capital. The recency of the position (active accumulation rather than legacy holding) and the asset specificity (Alexandria rather than a diversified REIT basket) make this among the most informed real estate-specific bids currently visible in public filings.
The third signal is at the real estate debt layer. The J.P. Morgan, Deutsche Bank, and Goldman Sachs joint refinancing of the Breakthrough Properties campus in San Diego at 90% occupancy provides clearance evidence on the lending side: three major institutional balance sheets underwrote new debt against a life science campus in early 2026 at terms that the public equity valuation implies should be uneconomic. The deal cleared. Real estate debt capital is returning to the sector at terms inconsistent with what the public ARE valuation is currently pricing.
Recent leasing activity provides additional data on the demand environment underlying these transaction comparables. The 466,598 RSF Novartis build-to-suit lease at Campus Point Megacampus, signed in July 2025, was the largest individual lease in Alexandria’s 32-year history. The 244,000 RSF Lila Sciences lease at Alewife Park in West Cambridge was the first major commitment from an AI-native biotechnology firm in the Boston cluster. The 498,000 RSF TransMedics lease in Greater Boston propelled the market to 1.1 million RSF of total leasing in the first quarter of 2026 - more than the entire second half of 2025. Pfizer expanded by 230,000 RSF across two buildings in San Diego.
Applying private-market cap rates of approximately 5.75% to 6.25% on Alexandria’s blended NOI base - consistent with where stabilized Class A and A+ product has actually traded in 2024 and 2025 - produces an operating real estate value of $29 to $32 billion. This is the high end of the convergence.
NAV Walk - Frame Three: Private Market Transaction Comparables (6.00% Cap)
Convergence
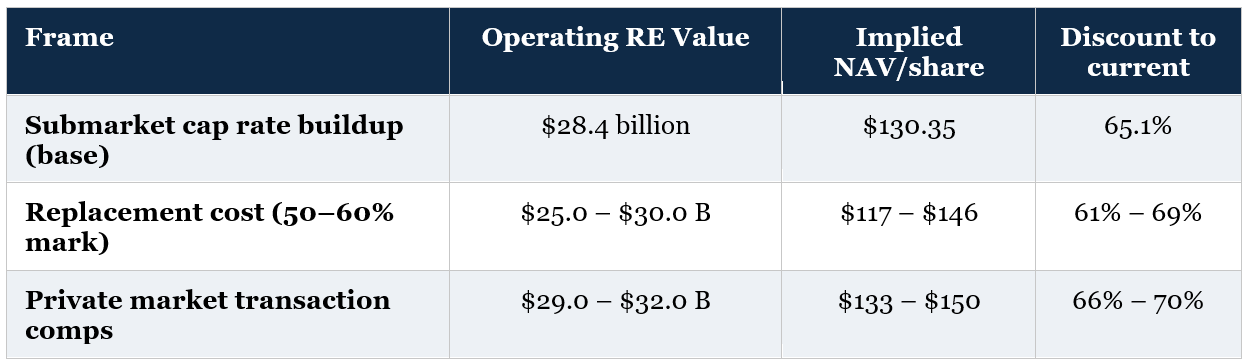
All three frames converge on an operating real estate value in the $25 to $32 billion range, implying total NAV of approximately $117 to $150 per share. The base case cap rate approach at $130 sits comfortably inside the convergence band. The triangulation is not perfect - different methodologies emphasize different aspects of value - but the directional agreement across three independent approaches is significant. The current $45.56 share price is meaningfully below the low end of all three frames.
The bimodal portfolio problem
The most important analytical error embedded in the current public market price is the implicit assumption that Alexandria’s 35.8 million RSF operating portfolio is homogeneous, and that a single capitalization rate appropriately reflects the risk and value of the entire base. The reality is sharply bimodal.
The Megacampus portfolio represents approximately 78% of annual rental revenue. It is concentrated in roughly six flagship campuses: the Alexandria Center at Kendall Square in Cambridge, the Mission Bay portfolio in San Francisco, the South San Francisco campus along the Genentech corridor, the Campus Point Megacampus in University Town Center, San Diego, the One Alexandria Square Megacampus in Torrey Pines, and the Alexandria Center for Life Science in New York City. These assets are genuinely irreplaceable in the strict economic sense: the underlying land is fully built out and held by long-tenured institutional owners; the cluster network effects took decades to form and cannot be recreated; and the cost economics of new construction are punitive for the foreseeable future.
The non-Megacampus portfolio represents the remaining 22% of annual rental revenue. This includes assets in Gaithersburg and Rockville, parts of Research Triangle, certain San Francisco Bay Area outparcel positions, Texas, Canada, and miscellaneous smaller holdings. Some of these assets are good. Some are average. Few are irreplaceable. They behave more like specialized commercial real estate with cyclical exposure to broader life science demand.
Public market valuation that applies a uniform implied cap rate to both buckets is making an obvious error. Megacampus assets trade - actually trade - at 5.50% to 6.25% cap rates in the current cycle. Non-Megacampus assets in secondary submarkets trade at 7.25% to 8.50% cap rates. The correctly weighted blended portfolio cap rate is the dollar-weighted average of those two distinct ranges, not a single uniform rate across the entire base. At a 6.0% cap rate on the 78% Megacampus revenue and a 7.75% cap rate on the 22% non-Megacampus revenue, the blended is 6.39% - almost exactly the 6.45% used in the base case NAV.
The market’s current implied 12-13% cap rate is consistent with applying a distressed cap rate to the entire portfolio - treating Mission Bay the same as a suburban Maryland office park. This is the mispricing. As the disposition program executes through 2026 and 2027, the bifurcation will be made explicit through transaction-level price discovery: non-Megacampus assets will sell at meaningfully wider cap rates than Megacampus assets, but neither category will clear at the 12% implied rate currently embedded in the equity. Each closing forces the public market to update toward the correct bifurcation.
There is a second-order effect worth highlighting. The portfolio bifurcation also affects how the long-term structural questions apply. AI-driven changes in biotechnology demand - discussed at greater length below - affect the two halves differently. AI-native biotechnology firms cluster aggressively in the same core submarkets where the Megacampus portfolio is concentrated, reinforcing demand for those assets. The non-Megacampus portfolio, by contrast, faces a more uncertain demand environment as the marginal mid-tier biotechnology tenant migrates either toward AI-native consolidation hubs (Megacampus markets) or toward lower-cost manufacturing locations (which Alexandria’s footprint also captures, in Research Triangle and Maryland).
The bifurcation argument has practical investment implications. The thesis on the Megacampus core is closer to a scarcity-asset structural thesis - these are assets that should command premium valuations even in difficult cycles, and the long-term trajectory is favorable. The thesis on the non-Megacampus tail is closer to a cyclical / capital recycling thesis - these are assets that should be marked at market clearing rates and pruned through the disposition program over the next 24 to 36 months. The current public valuation effectively treats both halves as the same kind of asset, which fundamentally mischaracterizes the portfolio composition.
Reverse engineering the implied bear case
Working backwards from the current share price provides a useful discipline for identifying what set of assumptions the public market is implicitly relying on. At $45.56 per share, with 173 million shares outstanding, the equity value is approximately $7.88 billion. Adding total debt of $12.76 billion and minority interest of $0.30 billion produces total enterprise value of $20.94 billion. Subtracting conservative marks on the non-operating asset categories - $2.50 billion on construction in progress, $2.50 billion on the post-impairment land bank, $1.50 billion on the venture investment portfolio, $0.55 billion of cash, and $0.20 billion of other net assets - yields an implied operating real estate value of approximately $13.66 billion.
Dividing into normalized cash NOI of $1,825 million gives an implied cap rate on the operating real estate of approximately 13.3%. At current depressed NOI of $1,672 million, the implied cap rate is approximately 12.2%.
There is no observable private market transaction at either of those cap rates for Class A or A+ life science real estate in core submarkets. Setting aside whether such pricing is even theoretically defensible, it is worth examining what set of assumptions the implied 13% cap rate actually requires.
What the bear case needs to be true
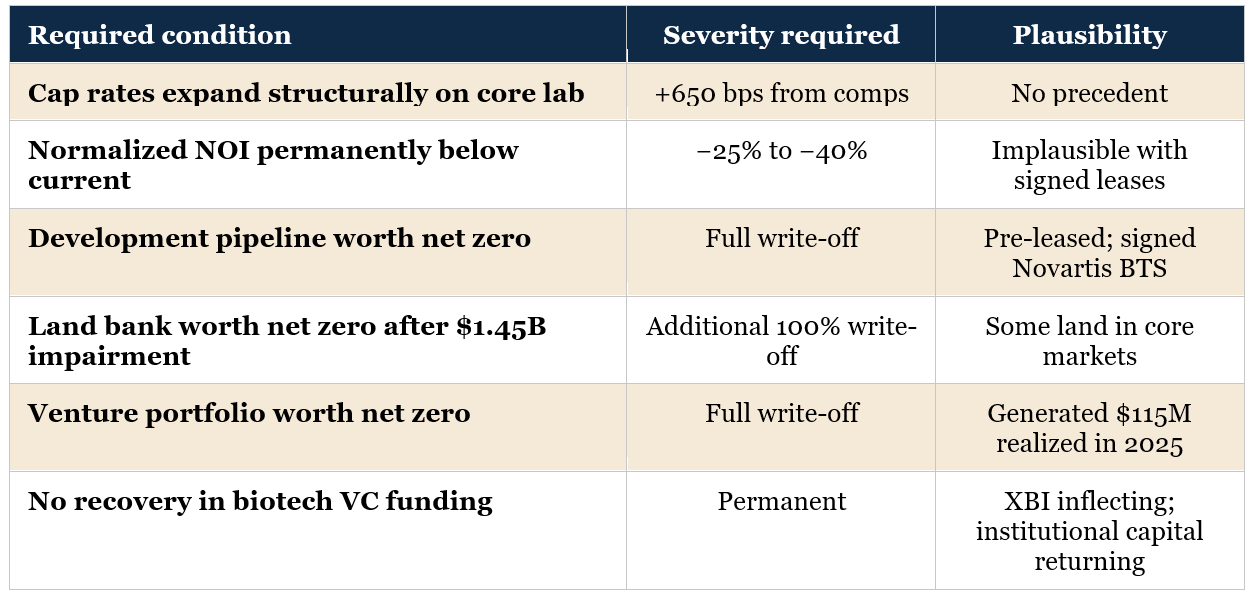
Each row of the bear case has some basis in current concerns. Cap rates have widened from the 2022 trough. NOI did decline meaningfully in 2025 and is guided to decline further in 2026. The land bank did take a $1.45 billion impairment. Biotech venture capital is below the 2021 peak. The bear concerns are not invented.
What the bear case fails on is severity and cumulative consistency. Each individual leg, taken to the extreme severity required to reconcile with the current share price, becomes implausible against observable evidence. Cap rates expanding 650 basis points beyond the current 6.6% transaction average would require a regime change without modern precedent. NOI permanently impaired 25-40% below current would require structural occupancy below 75% indefinitely, despite 91% Megacampus occupancy, a 1.1 million RSF queue of signed-not-delivered space, and a 16-year Novartis build-to-suit lease commencing in 2028. The development pipeline going to net zero would require management to abandon $3.5 billion of pre-leased construction in progress, including projects with anchor tenants on signed long-term leases.
A more realistic bear case
A plausible bear case would look quite different. Imagine cap rates settle at 7.50% blended (50-100 bps above current observed comparables, reflecting a permanently more cautious capital base). Imagine normalized NOI is 5% below the $1,825 million base (closer to $1,735 million, reflecting modestly worse 2027 mark-to-market and a slower recovery to 92% occupancy). Imagine the residual land bank takes another $500 million of impairments through 2027. Imagine the venture portfolio is haircut to $1.0 billion. The math under those assumptions:
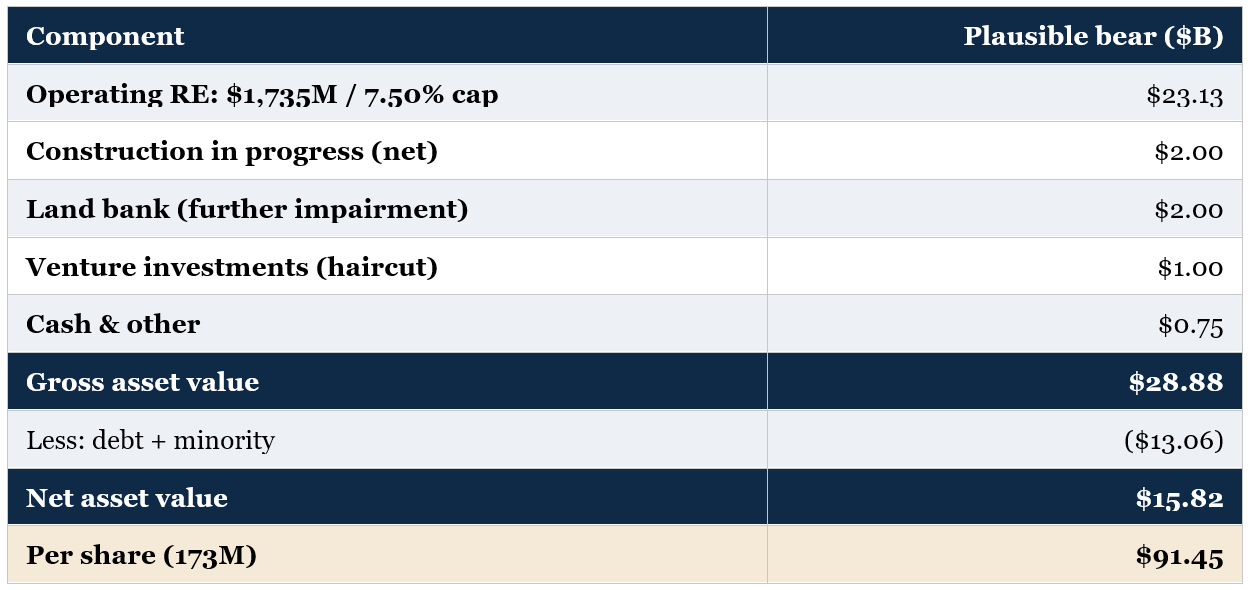
Even under a plausible bear case that applies meaningfully more conservative assumptions to every input, the implied NAV is approximately $91 per share - double the current price. To get a NAV below the current $45.56 requires assumptions that have no support in observable transaction data.
The permanent-impairment case
For readers who fundamentally reject the cap rate methodology, or who believe the laboratory real estate market is in structural rather than cyclical decline, it is worth working through what the math actually requires. Push cap rates to 9.0% - three full percentage points above the highest observed 2025 transaction comparable, and a level no Class A or A+ life science asset has cleared at in living memory. Push normalized NOI down another 10% from the plausible bear case to $1,560 million, reflecting permanent occupancy at 88% rather than recovery to 92% and a structurally worse 2027 mark-to-market profile. Take another impairment on the development pipeline, the land bank, and the venture portfolio. The math is below.
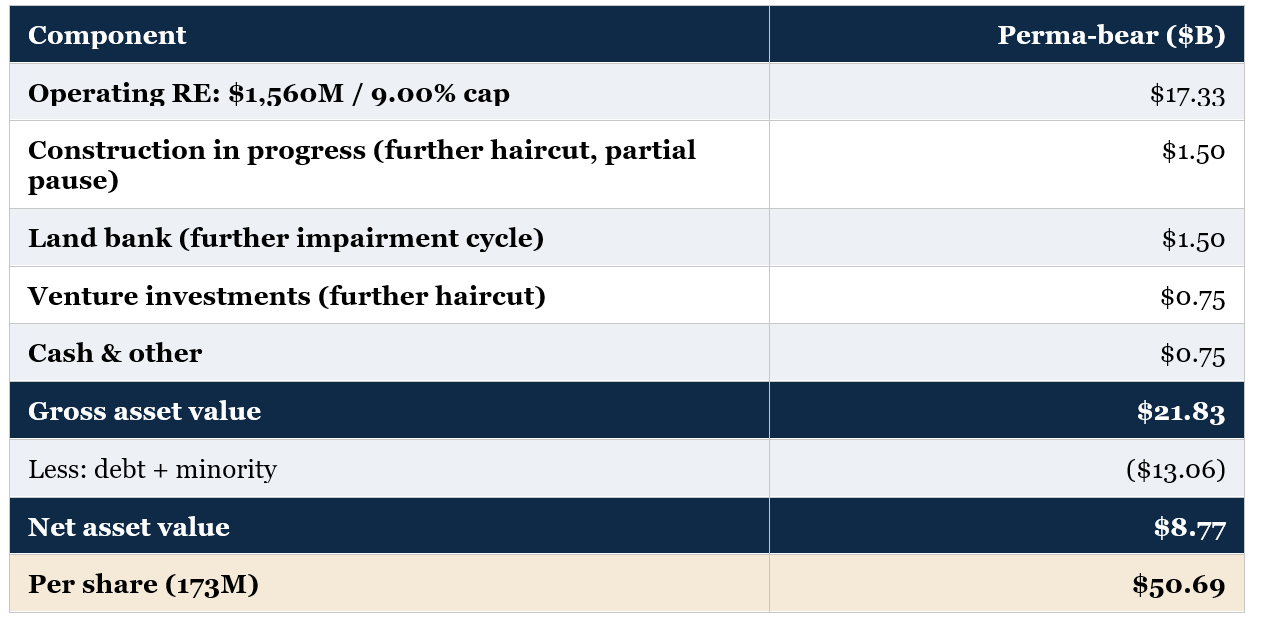
Even this scenario - which combines a cap rate that has no transaction evidence anywhere in the public record, a structural NOI impairment well beyond what the company has guided to, and another full impairment cycle on the non-operating bucket - produces an implied NAV of approximately $51 per share. That is roughly the current price, suggesting the equity is reasonably valued only if the reader accepts a coordinated worst-case across every value driver simultaneously. There is no plausible scenario, on the math, in which the equity has meaningful downside from current levels. The floor is anchored by the assets themselves: irreplaceable real estate in core innovation submarkets does not trade at a 9% cap rate, regardless of how persistent the current cycle proves to be.
Three structural concerns and why they are not fatal
The cyclical case for Alexandria is straightforward: supply is shutting down, demand is bottoming, institutional capital is returning, and the disposition program will force public price discovery on asset values. The harder question is whether there are structural concerns that justify the equity trading at a permanently wider discount to asset value than its historical range would suggest. Three structural concerns deserve serious engagement: artificial intelligence’s effect on per-employee laboratory footprint, the migration of pharmaceutical research and licensing to China, and the company’s ongoing capital expenditure commitments. None of them, on careful examination, are fatal to the thesis.
Concern one: AI and the per-employee footprint

The bear narrative on AI is that AI-native biotechnology firms lease materially less laboratory space per employee than traditional biotechnology firms. JLL’s 2025 Life Sciences Real Estate Perspective documented that AI-native biotechs operate at approximately 45% laboratory and 55% office allocation, compared to traditional biotechnology firms at approximately 60% laboratory and 40% office, and lease roughly one-third less total space per employee. If AI fundamentally rebalances the discovery process toward computational work and away from wet laboratory experimentation, aggregate demand for laboratory space could structurally decline even if the industry grows.
This concern is real but is largely misdirected. The error is conflating per-employee footprint with aggregate space demand. These are different metrics that move independently. If artificial intelligence increases the productivity of biotechnology researchers - and the evidence strongly supports that it does - the rational industry response is not to maintain the same headcount in less space. It is to hire more researchers and run more drug discovery programs, because the marginal economic value of an additional drug program at a major pharmaceutical company is in the billions of dollars while the marginal cost of an additional 10,000 square feet of laboratory space is approximately $1 million per year. Space cost is a rounding error in program economics. As AI makes program execution more productive, the rational response is to run more programs, which requires more aggregate laboratory capacity even at lower per-employee footprints. The biotech industry is not space-constrained because of headcount; it is space-constrained because of the cost-benefit of running additional programs.
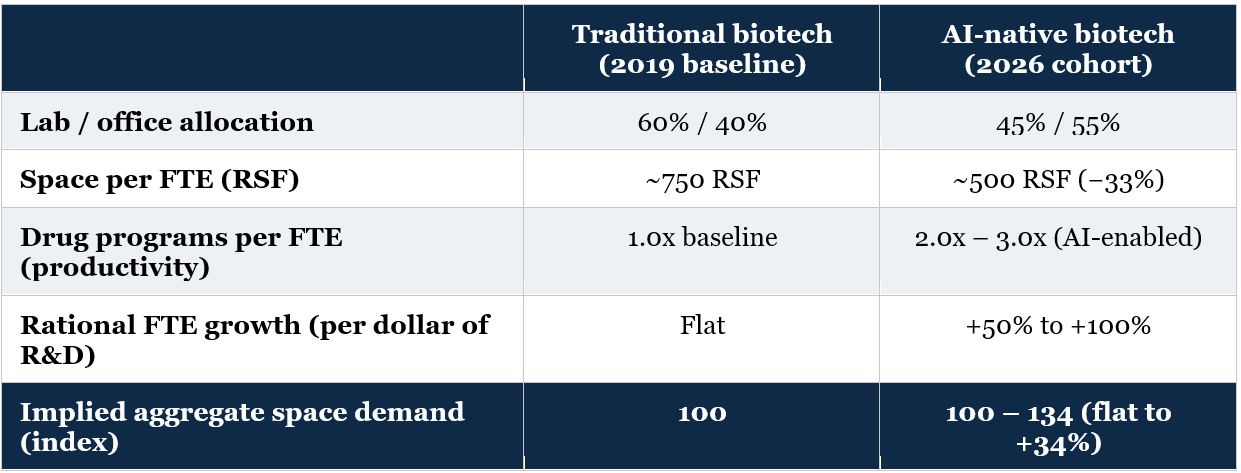
The illustrative arithmetic: a 33% reduction in space per FTE, combined with a 50% to 100% increase in employee count driven by AI-enabled productivity, produces aggregate space demand that is flat to 34% higher than the traditional baseline. The per-employee footprint metric, taken in isolation, is misleading. The relevant question for aggregate laboratory demand is the product of headcount and per-FTE footprint, and only the most pessimistic combination of assumptions produces an aggregate decline.
Second-order effects reinforce the demand picture. The cell and gene therapy supercycle, which is well underway, requires substantially more specialized laboratory and GMP manufacturing space per program than traditional small molecule discovery - viral vector production facilities, BSL-2 and BSL-3 containment, vivariums for in vivo testing, clean rooms with stringent particulate control, and bioreactor infrastructure for autologous cell manufacturing. These specialized space categories are not displaceable by computational work; they are physical infrastructure requirements that scale with the number of programs in clinical and commercial production. Biomanufacturing onshoring further reinforces the trend: leading pharmaceutical firms have announced more than $270 billion of new U.S. biomanufacturing investment, much of which will require purpose-built specialized real estate over the next 5 to 10 years.
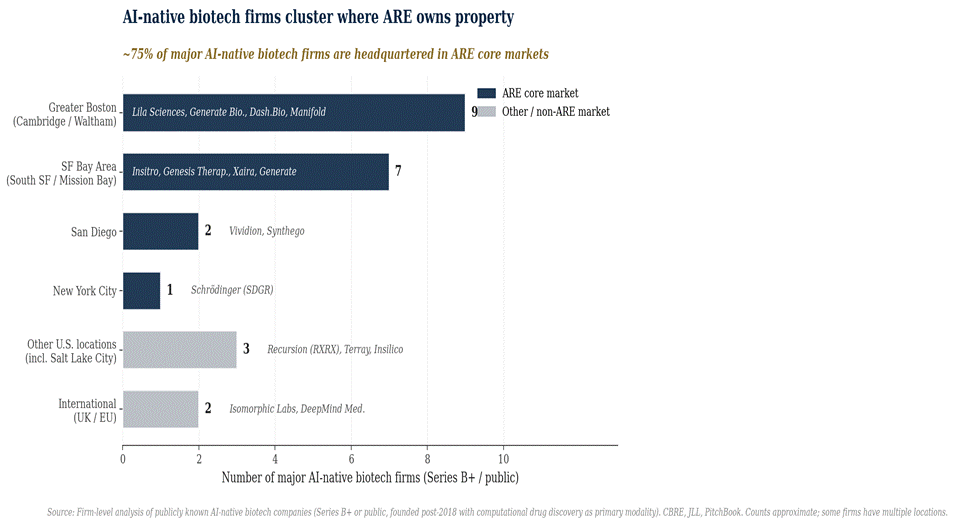
Most critically for Alexandria specifically, AI-native biotechnology firms are not geographically dispersing - they are concentrating aggressively in the same submarkets where the Megacampus portfolio is positioned. Lila Sciences signed 244,000 RSF in West Cambridge after emerging from stealth mode. Dash.Bio executed a 24,000 RSF lease in Waltham. Genesis Therapeutics, Generate Biomedicines, and Insitro - the dominant AI-native cohort - is clustered in Cambridge and the San Francisco Bay Area, where the intersection of computational and biology talent is geographically rare. The cluster network effects that have driven biotechnology geography for decades intensify with AI rather than diminishing. The aggregate demand effect for Alexandria’s core market positioning is modestly positive, not negative.
Concern two: China and the migration of intellectual property
A more recent concern that has gained traction in industry commentary is the rise of Chinese biotechnology in-licensing activity. JLL reported that Chinese biotechs now account for approximately four times the in-licensing deals for U.S. biopharma compared to 2021 levels, representing a substitution of Chinese intellectual property for American IP. If U.S. biopharmaceutical companies are increasingly sourcing molecules from China rather than developing them domestically, the implication for U.S. life science real estate demand is negative - fewer molecules in domestic clinical trials, less domestic discovery infrastructure required.
The China concern is partially valid but is overstated in its current framing. The Chinese in-licensing wave is real, and reflects the genuinely impressive scientific capacity that has developed in Shanghai, Beijing, and Shenzhen over the past decade. However, three counterbalancing factors limit the impact on U.S. laboratory demand. First, in-licensing deals typically involve U.S. pharmaceutical companies acquiring or partnering on Chinese-discovered molecules for clinical development and commercialization in U.S. and global markets. The clinical development work - which represents the bulk of the spending and the most space-intensive activities - is performed in the U.S. regulatory framework using U.S. clinical research infrastructure. The shift is in where discovery occurs, not where development and commercialization occur. Second, U.S. pharmaceutical companies maintain large internal discovery operations regardless of external sourcing - Pfizer, Eli Lilly, Merck, Bristol Myers Squibb, AbbVie, and Johnson & Johnson together operate millions of square feet of internal research space that is not displaced by external in-licensing. Third, an accelerating policy concern about U.S. dependence on Chinese pharmaceutical capacity is producing onshoring pressure that runs in the opposite direction: the $270 billion in announced U.S. biomanufacturing investment specifically reflects political and supply chain concerns about Chinese pharmaceutical dependence.
The net effect of the China dynamic on U.S. life science real estate demand is probably mildly negative on the discovery side and meaningfully positive on the manufacturing side. Alexandria’s portfolio is positioned across both, with the Boston, Bay Area, and San Diego Megacampuses skewing toward discovery and the Research Triangle and Maryland positions skewing toward development and manufacturing-adjacent uses. The net portfolio exposure to the China dynamic is approximately balanced.
Concern three: capex commitments and the dilution overhang
The third structural concern is the company’s ongoing capital expenditure commitments and the latent risk of dilutive equity issuance. Alexandria has approximately $3.5 billion in total development basis on the construction in progress pipeline, with remaining capital expenditures of approximately $1.2 billion required to complete current projects. Net debt plus preferred to Adjusted EBITDA is 6.8x on first-quarter 2026 annualized - above the company’s target band of 5.6x to 6.2x. The disposition program of $2.9 billion is the explicit mechanism for deleveraging back to target, but execution risk is non-trivial.
If dispositions stall or clear at materially wider cap rates than the company has implied, the path to the leverage target narrows. In a downside scenario, the company could face a choice between (a) selling additional, higher-quality assets at suboptimal cap rates to make up the shortfall, (b) reducing the development capex by pausing or deferring projects (which has costs both in carrying value and in tenant relationship terms), or (c) issuing equity at depressed share prices to fund balance sheet objectives. Issuance at $40 to $50 per share would dilute existing shareholders by approximately 12-13% for every $1 billion raised - a meaningful overhang on the equity multiple.
The latent dilution risk is real and is part of the explanation for the current discount. It is not, however, a structural impairment in the way that a permanent demand collapse would be. The risk is timing-bound: if the disposition program executes in 2026, leverage hits target in early 2027, and the equity issuance risk dissipates. The company has explicitly stated a preference to avoid equity issuance and to fund deleveraging through dispositions. The $4.17 billion of liquidity, combined with the longest weighted-average debt maturity in the S&P 500 REIT universe at 10.0 years, means the company has substantial runway to execute the dispositions on a reasonable timeline rather than under duress. The probability of forced near-term equity issuance is low; the probability of a measured issuance at higher prices in the future, after the discount has narrowed, is meaningfully different from the punitive dilution scenario priced in today.
Founder era, operator phase
Joel Marcus founded Alexandria in 1994 and led the company through its 1997 IPO. He served as Chief Executive Officer through April 2018, when he transitioned to Executive Chairman and the company appointed co-CEOs Stephen Richardson and Peter Moglia. Richardson retired in July 2022, leaving Moglia as sole CEO; Moglia has also served as Chief Investment Officer since September 2023. Moglia joined Alexandria in 1998 and has been at the company in capacities of increasing scope for over twenty-six years. The senior team beneath the CEO has multi-decade tenure, with regional market directors and development leads who have built the Megacampus ecosystems through 15 to 25 years of relationship work with anchor tenants, academic institutions, brokers, and municipal authorities.
This is, in practice, a founder-era company operating in an operator phase. The strategic vision - concentrating multi-billion-dollar investments in a small number of irreplaceable innovation cluster submarkets - was Marcus’s. The execution platform that translates that vision into operational results is Moglia’s. The Megacampus premium, the 91% occupancy outperformance against market vacancies in the mid-70s, and the 72% leasing volume share from existing tenants - these are evidence that the platform Marcus built and Moglia operates has genuine economic value beyond the underlying real estate.
Insider ownership is substantial in absolute terms. Marcus held approximately 17.7 million shares as of recent reporting, Moglia approximately 10.3 million. Together, these two executives directly hold approximately 28 million shares - a position with a market value of approximately $1.3 billion at the current share price. Aggregate insider ownership on a fully diluted basis is approximately 1.7%, which is modest as a percentage but represents substantial nine-figure absolute exposure. The skin in the game is real and the long-term alignment is favorable.
Three areas merit honest concern. First, the development pipeline was overextended in 2022 through 2024 when capital was abundant and demand expectations were elevated. The $1.45 billion impairment in the fourth quarter of 2025 was a corrective action to underwriting assumptions that proved overly optimistic. The two largest individual writedowns - 88 Bluxome Street in South of Market and a Greater Boston land parcel - were the most exposed positions in the speculative pipeline. The credibility cost is real, even if the corrective marks are now in place. Second, the dividend reduction in the third quarter of 2025 (a 45% cut from $1.32 quarterly to $0.72) was necessary to align the payout with current cash generation and preserve capital for deleveraging, but arguably could have been executed earlier. The market interpreted the timing as reactive rather than proactive. Third, the company’s external communication tilted toward promotional framing during the 2022-2024 period in a way that did not anticipate the cyclical downturn. The credibility damage from the gap between prior guidance and actual results is part of the discount.
The next 18 months are a clean execution test rather than a strategic vision test. Three specific items will determine how the management grade evolves. First, the disposition program at $2.9 billion: clearing at cap rates in the 6.0% to 7.0% range validates the asset-level thesis; clearing wider validates the bear case. Second, the leverage trajectory: reaching the 5.6x to 6.2x target by year-end 2026 removes the equity issuance risk; missing it sustains the overhang. Third, the leasing pipeline: continued momentum on build-to-suit and pre-leased development, combined with the second-half 2026 occupancy inflection, validates the demand environment thesis.
The available evidence is that the team is appropriately focused on these execution priorities. The 30% G&A reduction in 2025 is in place. The disposition program has begun executing. The dividend has been right-sized. The communication style has shifted toward more measured framing, with management acknowledging the cyclical pressures rather than dismissing them. Moglia is the appropriate operator for the current phase, with deep institutional knowledge of the portfolio and clear ownership of the deleveraging and capital recycling agenda. The management grade is B+: not perfect, but credible and appropriately matched to the current operational requirements.
What could break the thesis
Five scenarios would meaningfully undermine the asset-level value case and justify a continued or wider discount to NAV. Each is plausible to some degree; none is the central case. Monitoring them is the right discipline for thinking about position sizing and exit conditions.
Distressed disposition pricing
The single most important risk is that the $2.9 billion disposition program clears at blended cap rates of 8-9% or wider. If the marginal institutional buyer for Alexandria’s assets requires cap rates of 8-9% across the portfolio, the asset-level NAV math collapses toward the current public market valuation, and the equity is appropriately priced near current levels. The first quarter or two of 2026 disposition data will provide the highest-resolution information on this risk.
2027 lease expirations clearing materially below current
Management has flagged 1.5 million RSF of 2027 expirations with approximately $97 million of annual rental revenue at risk. Expected downtime is 6 to 24 months on a weighted-average basis. If actual mark-to-market on these rolls comes in at negative 15% to negative 20% - versus the negative 9% to negative 10% currently being observed on first-quarter 2026 renewals - normalized run-rate NOI could be $50 to $75 million lower than the $1,825 million base case. The leasing activity through the second and third quarters of 2026 will provide a leading indicator on the likely 2027 profile.
AI-driven structural demand impairment validated by data
If the AI-native biotechnology cohort maintains structurally lower per-employee laboratory footprints as it scales to commercial-stage operations, the aggregate demand for U.S. laboratory space could fail to recover to pre-2022 trend levels. The thesis assumes that aggregate demand recovers and that Alexandria’s geographic concentration captures a disproportionate share of that recovery. If both legs prove wrong, the structural bull case erodes.
Additional impairments to the residual land bank
The post-impairment carrying value of the land bank is approximately $2.75 billion. Most of the most-exposed individual positions have likely been marked, but residual exposure exists in lower-quality submarkets and in older entitlement positions where leasing prospects are weaker. An additional $500 million to $1 billion of impairments through 2027 would be a second-cycle credibility event and would damage the case that the impairment cycle is largely behind the company.
Rate cycle reversal
Alexandria’s long-duration debt structure (10.0-year weighted average maturity, 9% of debt maturing through 2028) provides substantial protection against rising interest rates on the existing capital structure. The equity, however, remains correlated with the broader REIT complex, which is sensitive to the 10-year Treasury yield.
Sizing, timing, asymmetry
The investment case rests on a few specific shapes of return. The base case implies the public market closes a substantial portion of the 60% discount over a 12 to 24 month horizon as the forcing functions accumulate. The bear case implies the discount sustains or widens modestly. The bull case implies a more aggressive convergence either through public re-rating or through strategic activity.
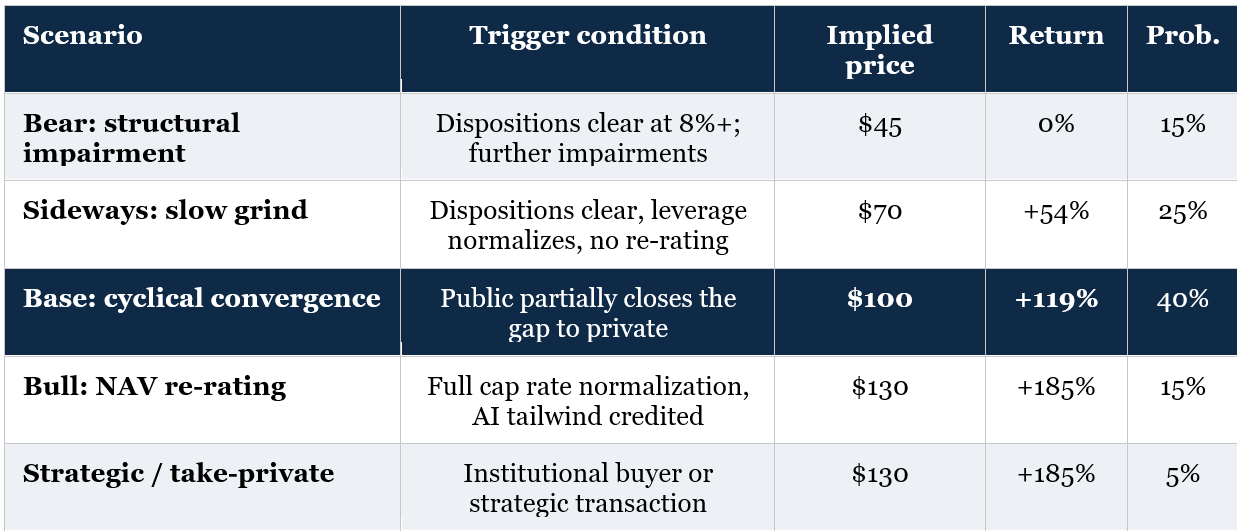
Probability-weighted expected price is approximately $89, representing 95% upside from current levels. Adding the current 6.3% dividend yield while waiting, expected total return is approximately 100% over the relevant horizon. The asymmetry favors patience: in the bear case, the downside is effectively zero (the asset value floor protects against further decline); in the base case, returns are substantial; in the bull cases, returns are exceptional.
The bear path is bounded. The replacement cost floor, the cluster economics, and the operating quality of the Megacampus portfolio make it implausible that the equity sustainably trades below the current level for an extended period without forcing strategic intervention from institutional real estate capital. The active accumulation by sophisticated real estate-specific investors - Town Lane being the cleanest current example - suggests the institutional bid is already forming at current price levels. The longer the discount persists, the higher the probability of strategic activity (partial portfolio transactions to institutional real estate principals, a take-private bid, or activist accumulation) that closes the gap mechanically rather than through public market sentiment.
On sizing, the appropriate position is one that allows the holder to tolerate sequential bear-case data points (a disappointing disposition print, a weak leasing quarter, an additional impairment) without forced selling. The catalysts are concrete but not all simultaneous; conviction is required to hold through the noise. A position size that the holder can carry comfortably for 24 to 36 months is the right calibration. The thesis is not a high-velocity trade; it is a structural mispricing that closes through a series of disclosed events over multiple quarters.
Closing the loop
Alexandria Real Estate Equities owns and operates the most concentrated portfolio of irreplaceable life science real estate in North America. The portfolio is bimodal: a Megacampus core of 78% of revenue from genuinely scarce assets in Cambridge, Mission Bay, South San Francisco, Torrey Pines, and University Town Center; and a non-Megacampus tail of 22% from secondary submarkets that behaves more like specialized commercial real estate. The current public market valuation treats both halves as homogeneous, distressed real estate, applying an implied 12-13% cap rate that has no precedent in observable private market transactions for the underlying asset quality.
Three independent valuation approaches - submarket cap rate buildup, replacement cost analysis, and private market transaction comparables - converge on an asset-level NAV of $117 to $150 per share. The current $45.56 sits meaningfully below the low end of all three. Even a plausible bear case that takes more conservative assumptions across every input produces a NAV of approximately $91, double the current price. The discount embedded in the current valuation requires a coordinated worst-case across multiple independent value drivers that is internally inconsistent in its severity.
The fundamental question is not whether the underlying assets are worth more than the current public market price. The private market has answered that question repeatedly through observed transactions, fund formation, leasing activity, and debt capital markets behavior. The question is the timing and mechanism by which the gap closes. The base case is a probability-weighted expected return of approximately 100% over a 12 to 24 month horizon, with materially favorable asymmetry and a downside floor anchored by replacement cost and cluster economics that cannot be erased by a cycle.
Mispricings of this magnitude rarely last.
I skimmed this one. I did my own write up on Alexandria.
https://thisisthemodernworld.substack.com/p/catch-22?utm_source=share&utm_medium=android&r=znto3
I re-read my post. It is a mere cocktail napkin compared to your work. I was at $73 a share, but not confident that the massive development pipeline could lease well. So I kind of hedged my comments. In the end, I wish I would have written a better article. There's too much of my own ambiguity and lame attempts at humor for it to be an effective piece. Oh well. C'est la vie. Reading your articles makes me want to improve my writing.
But I'm with your thesis: biotech investing is a risky lottery. ARE is a low-downside way to get exposure to the industry. I guess I am hoping for a leg down to acquire shares. I suspect they will need to cut the dividend (again). Once the stock re-rates, that's my entry. Well, that's my theory anyway.
Thanks again.